Gene expression
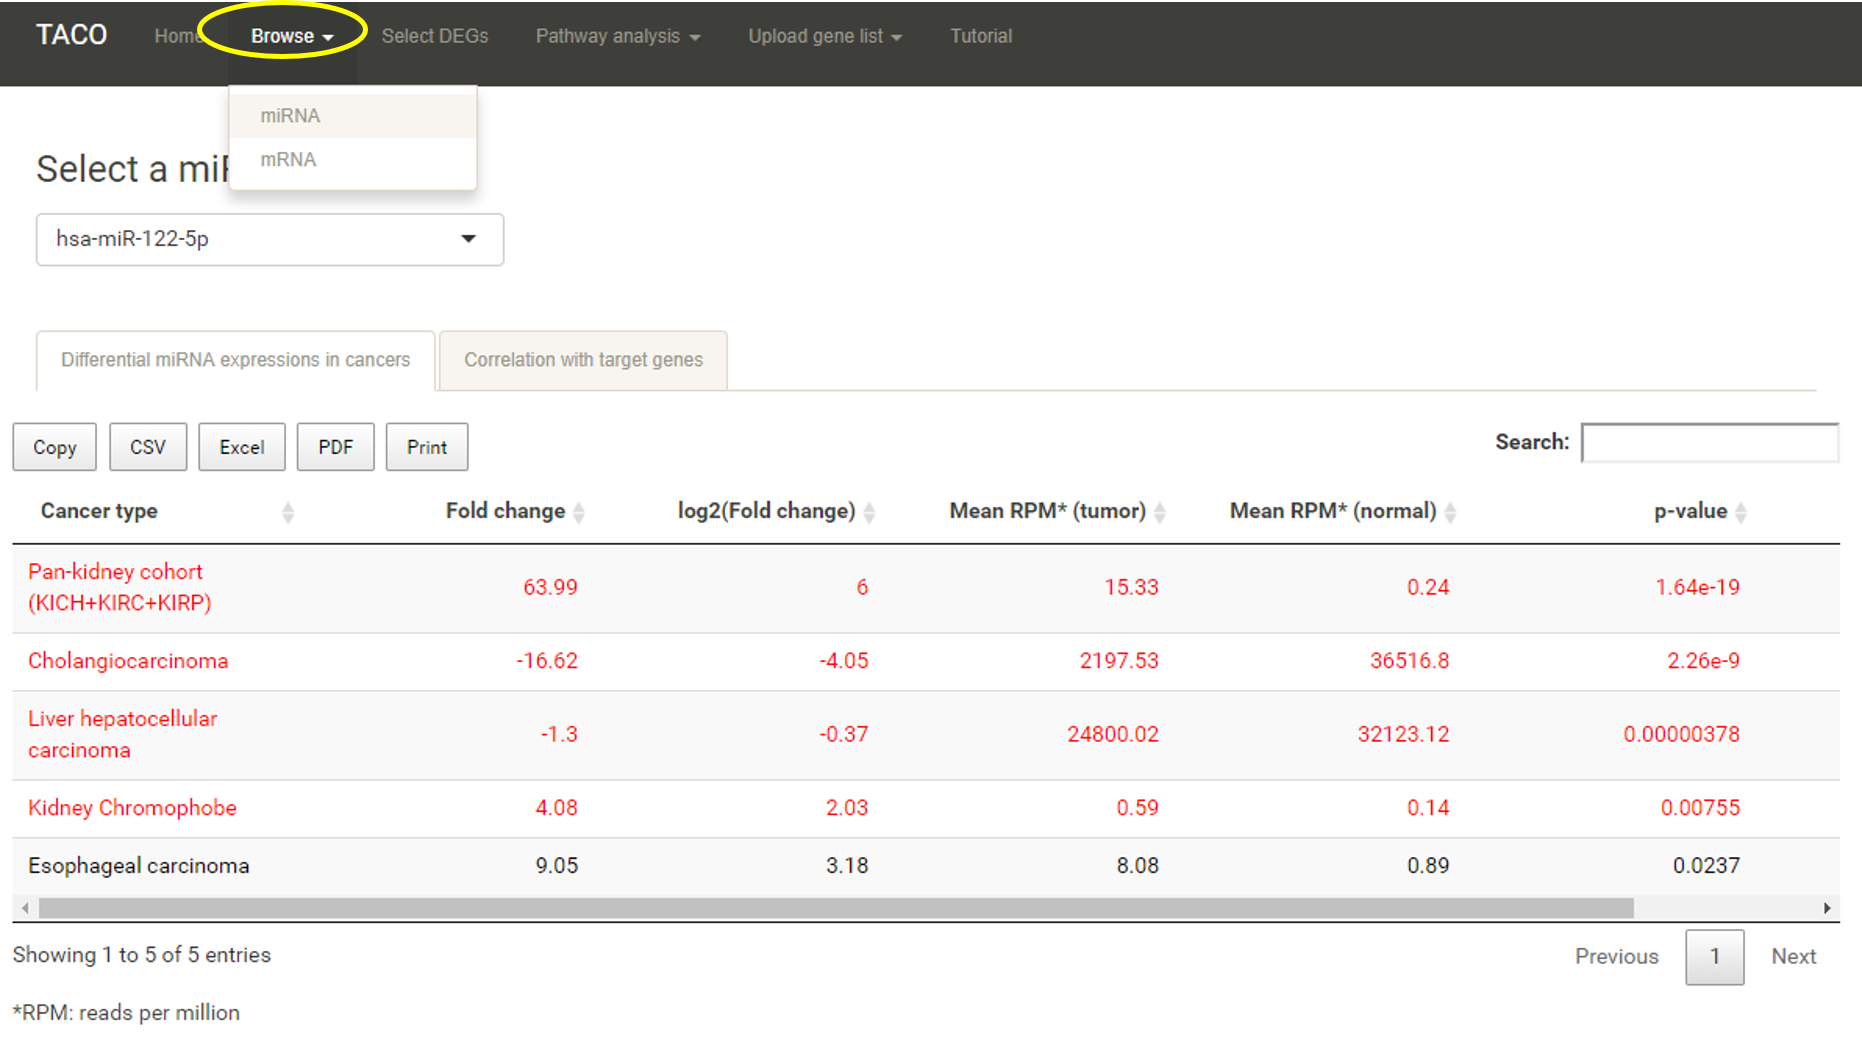
Users can browse both the expression levels of miRNAs or mRNAs in TACCO. After a specific gene/miRNA is selected, a table listing fold changes,
expression levels and p-values are shown.
Significantly up/down regulated gene will be presented in red and green respectively.
Users can select or type a different gene/miRNA and the table will be updated on the fly. The table can be downloaded as a csv, excel or PDF file.
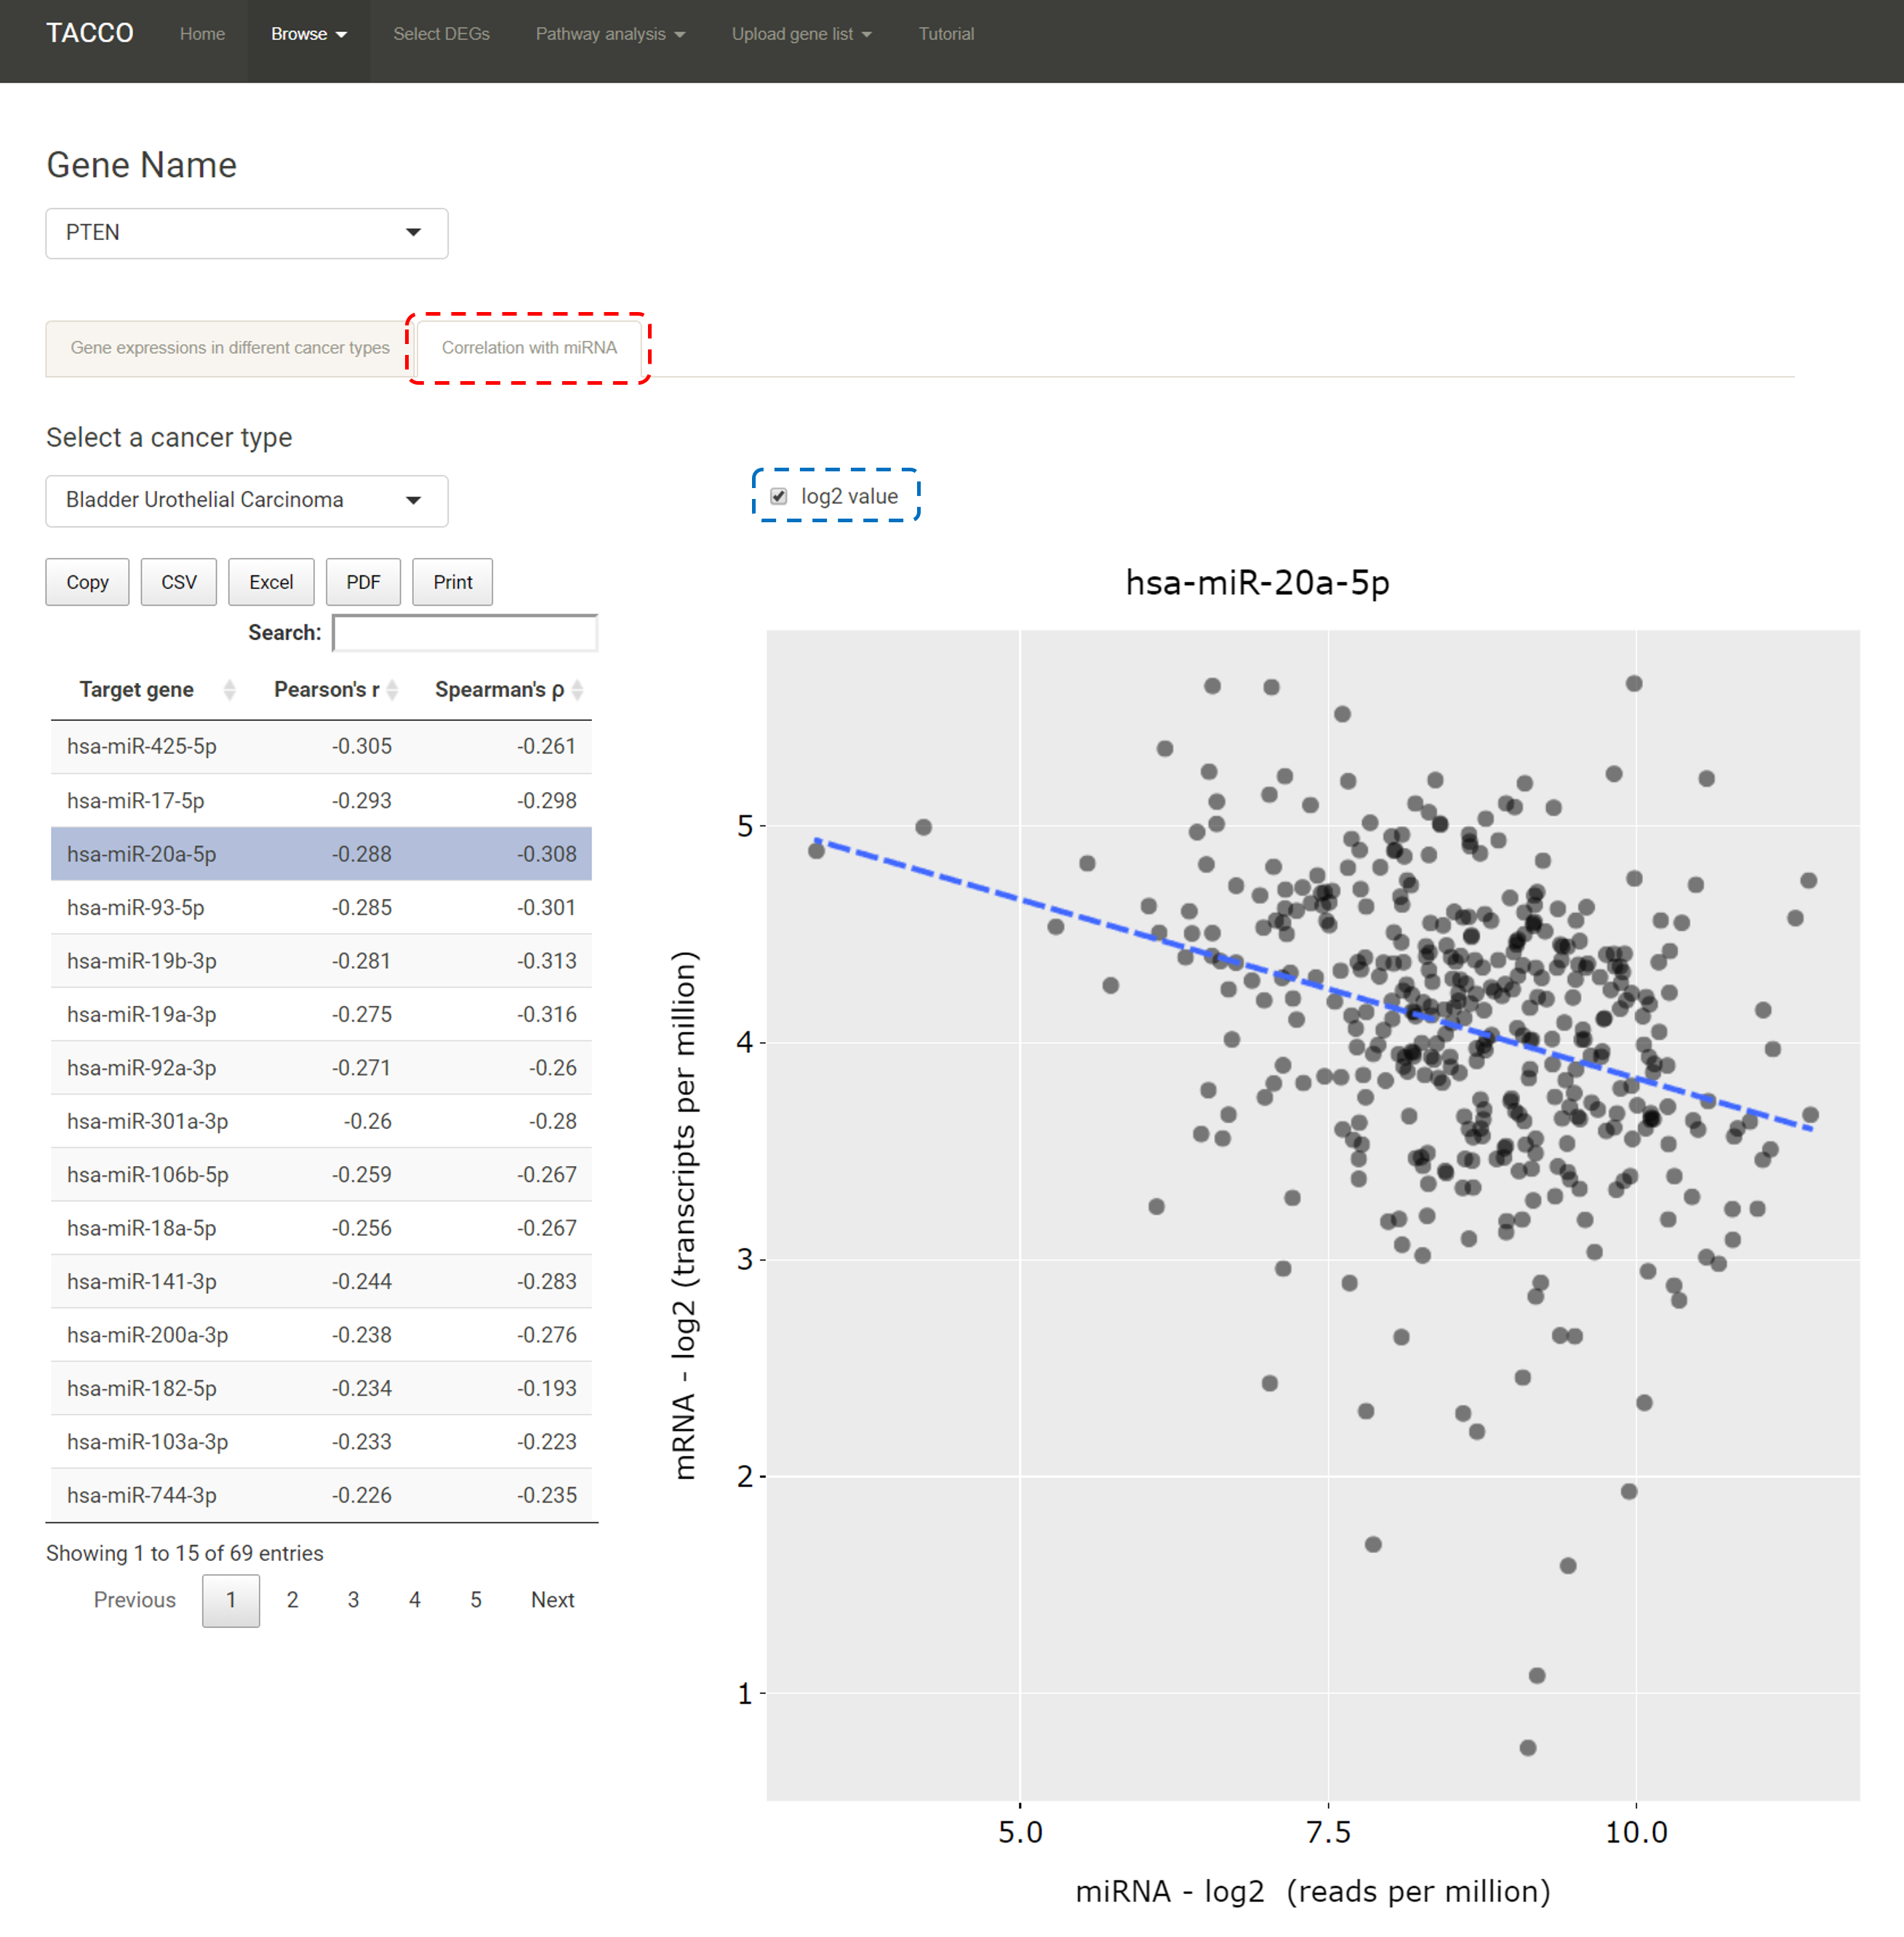
TACCO also provides correlation between the expression between miRNAs and their target genes. After users select an target gene of interest and specific cancer type, TACCO will present both the Pearson's r and Spearman's ρ. Users can check the log2 value check box (highlighted by the blue box) to obtain the correlations of log2 transformed expressions.