Prognosis prediction model/cancer stage classification model construction with uploaded gene list
Prepare a list of genes
After users have uploaded a list of miRNAs, users can first browse the expression levels of these miRNAs and their target genes in different cancer types in TACCO. Users can select a cancer type and the expression levels, fold changes and p-values for the uploaded miRANs or their target genes in that cancer type will be listed in the table. Users can then click on "Go to prognosis/stage analysis".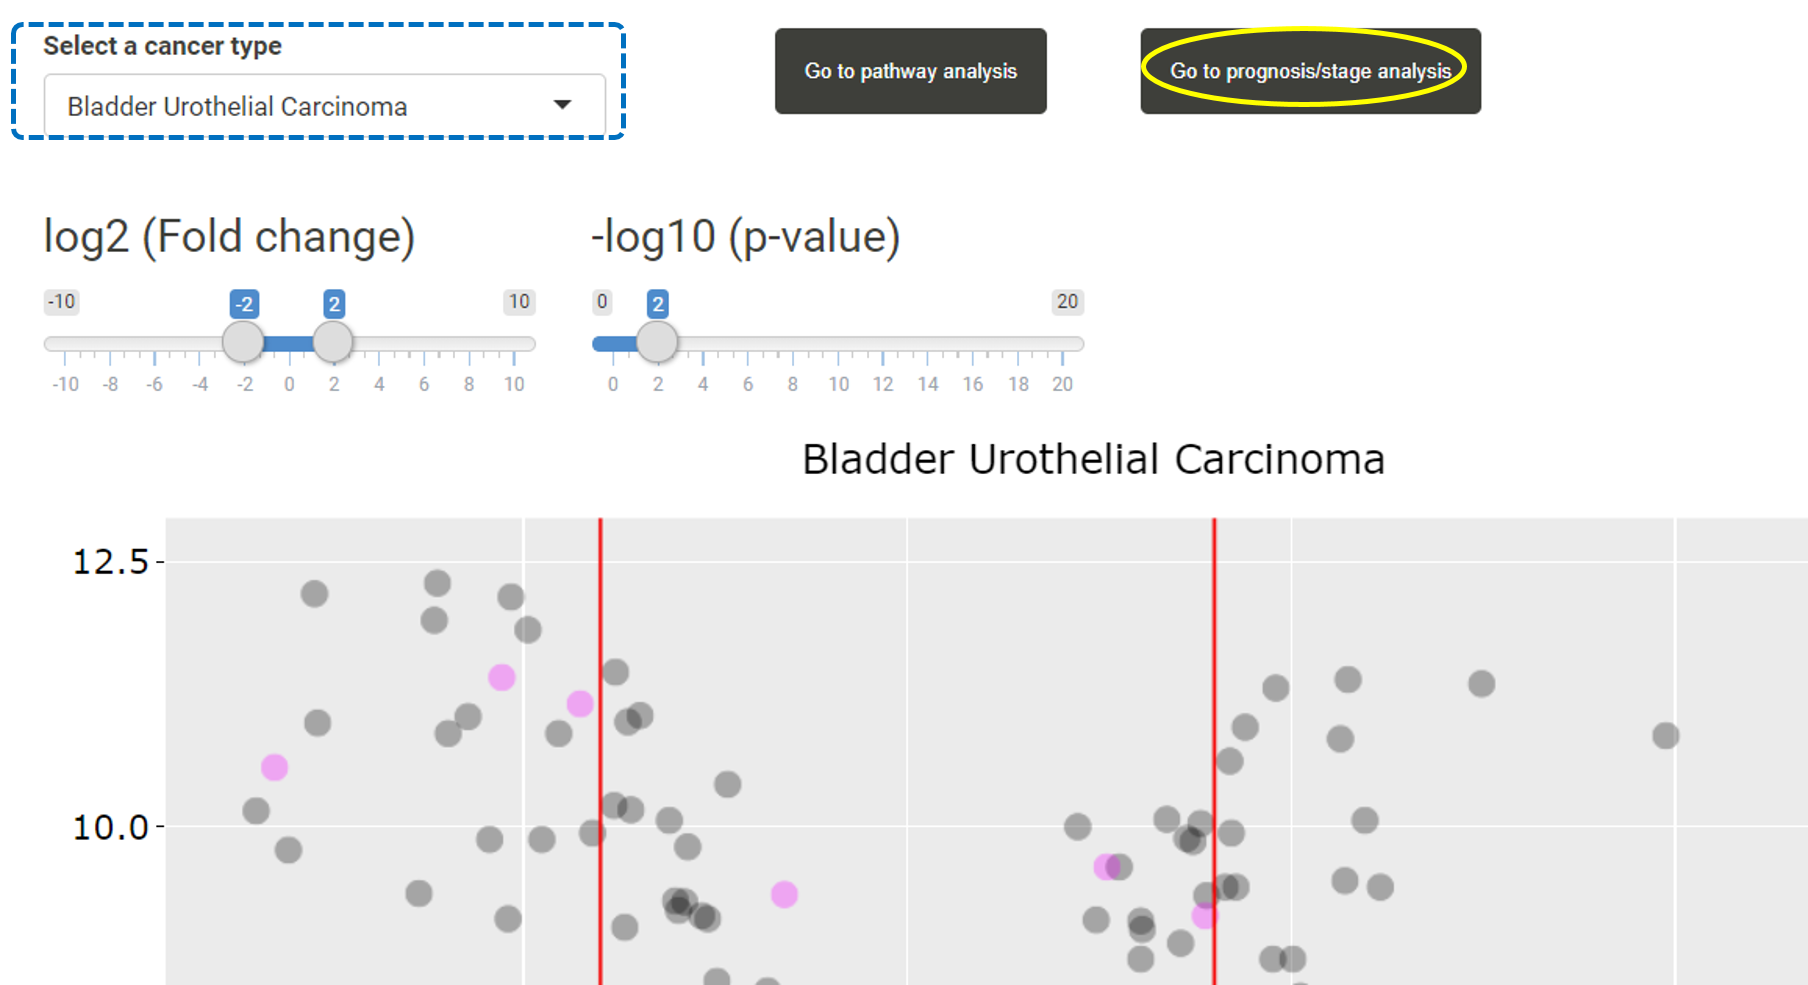
*GLM is only available when less than 30 features are selected.
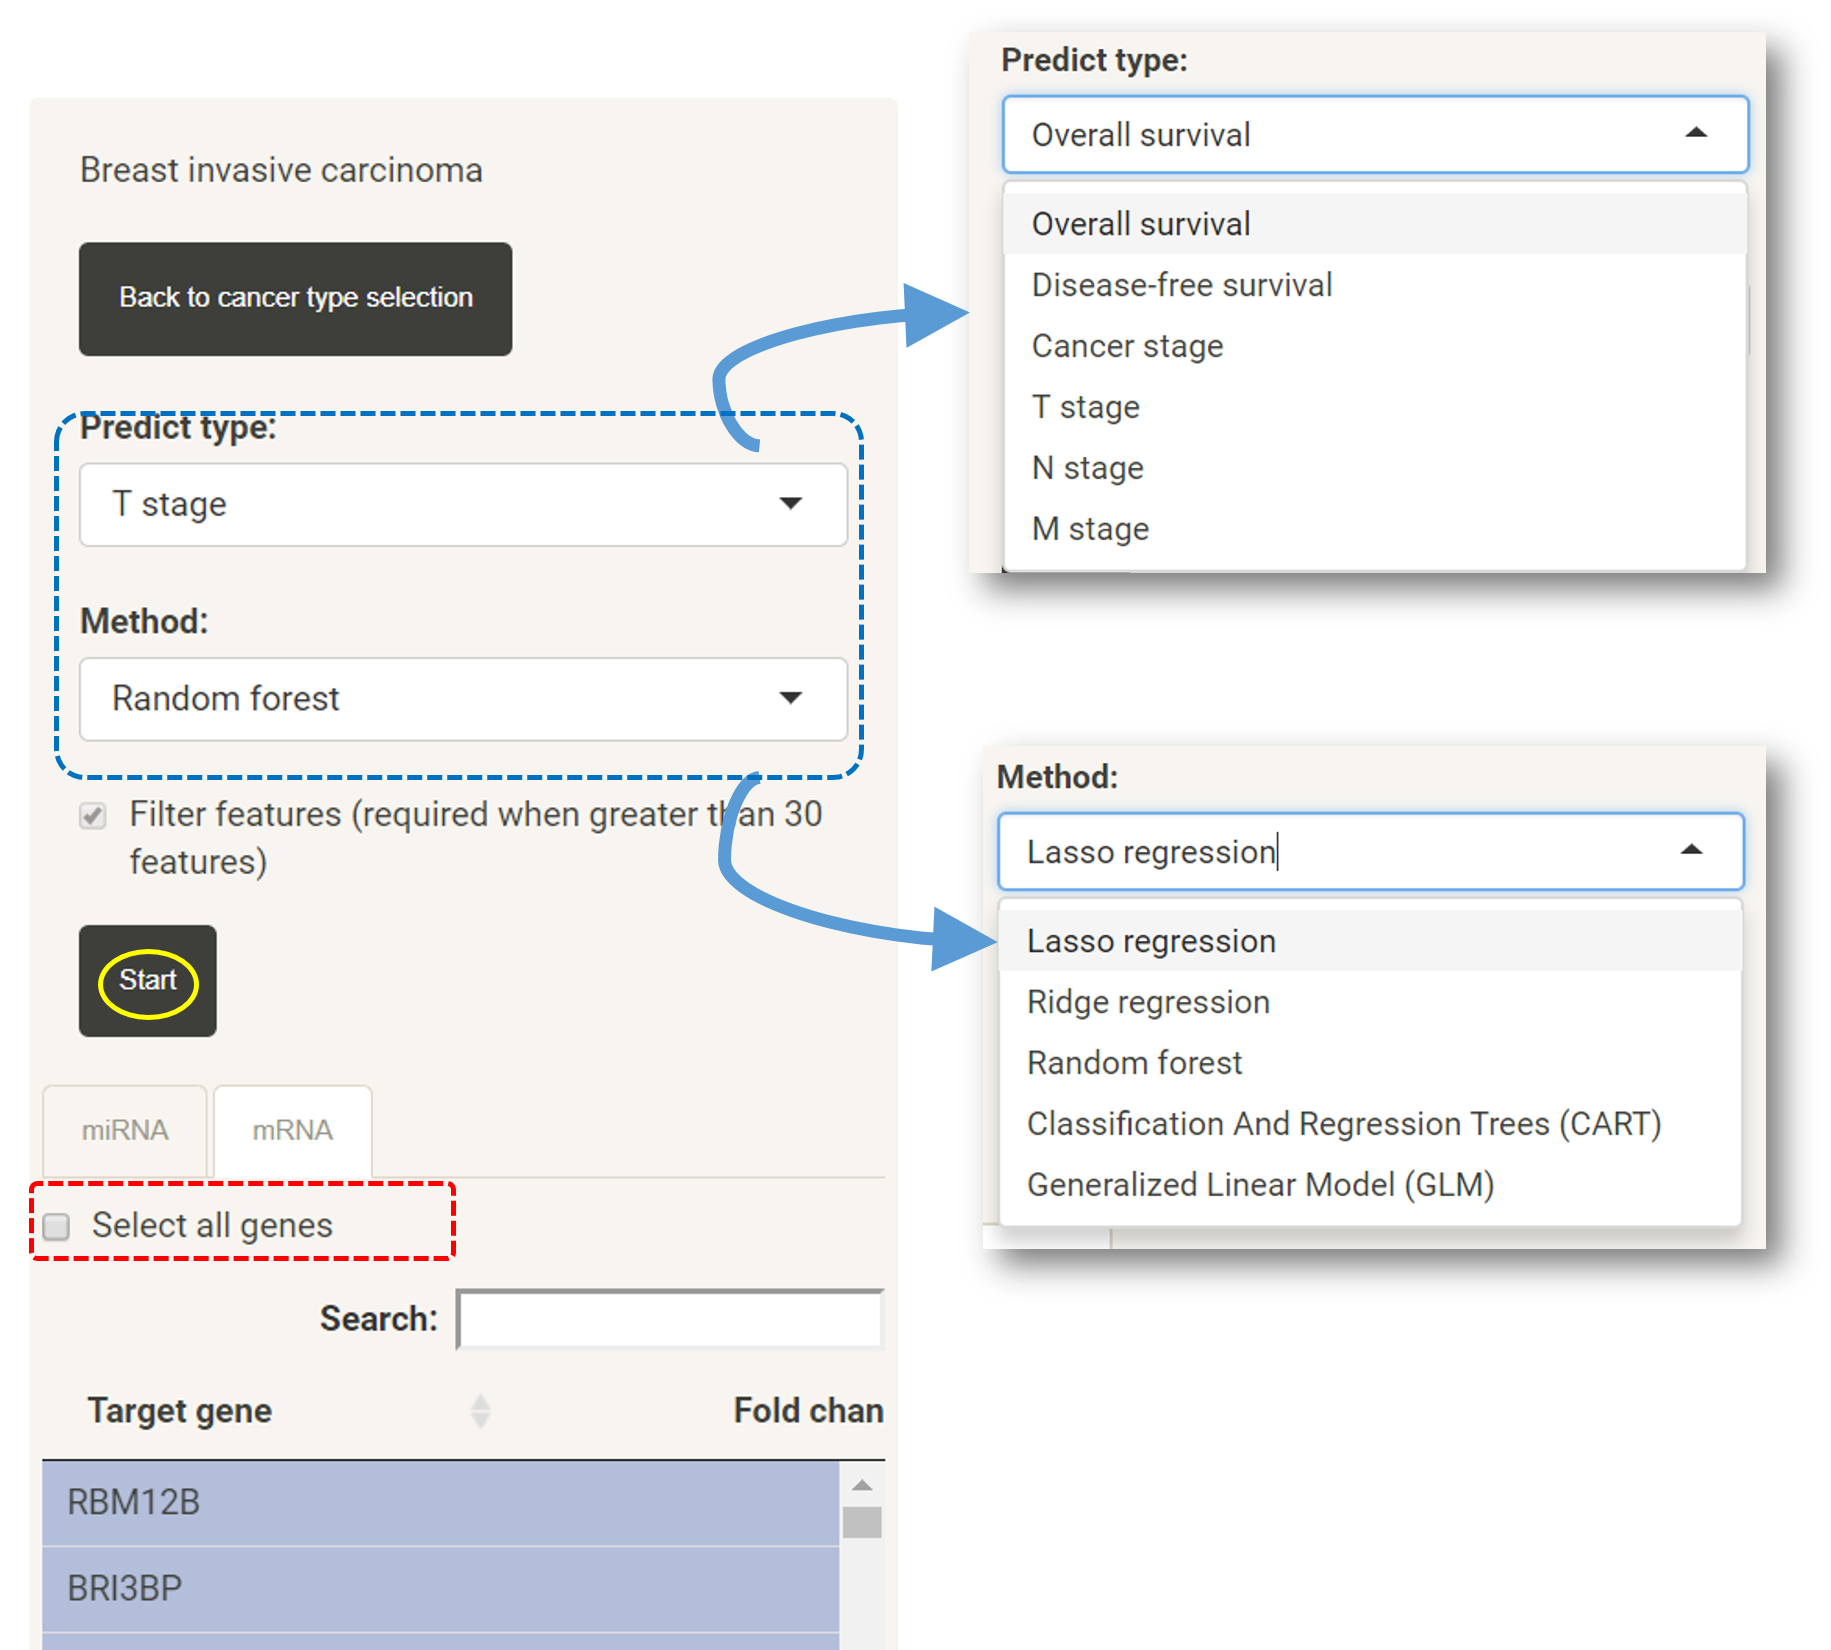
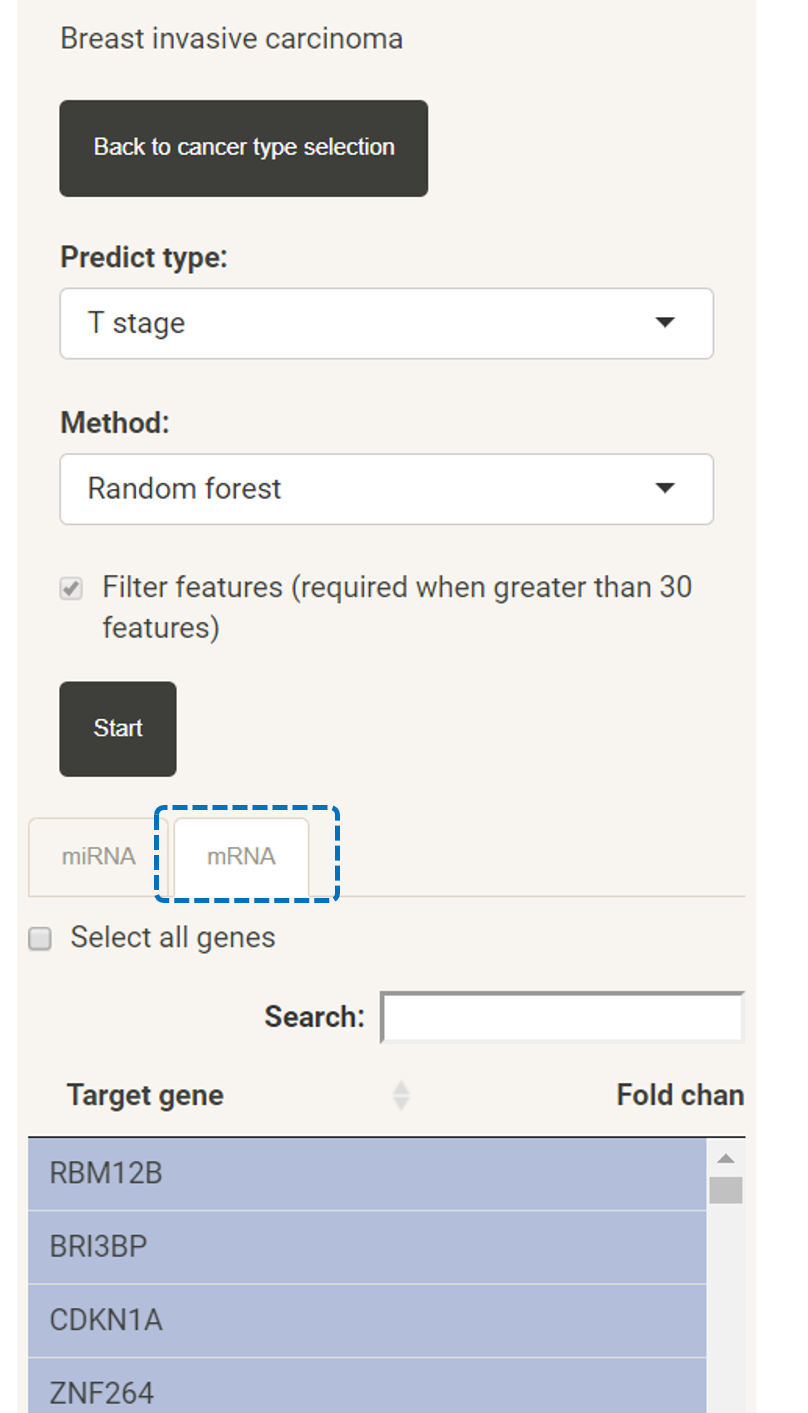
In survival analysis page, users can also select the target genes of the uploaded miRNAsbased on fold changes, expression levels or p-values and a subset of targeted genes (the blue box).
Survival analysis results
TACCO constructs a prediction model and tests the prediction results with the log-rank test. The prediction results are shown in the Kaplan-Meier plot. The p-value of log-rank test is shown on the plot. In addition to the Kaplan-Meier plot, TACCO also lists the number of patients at risk for different time points.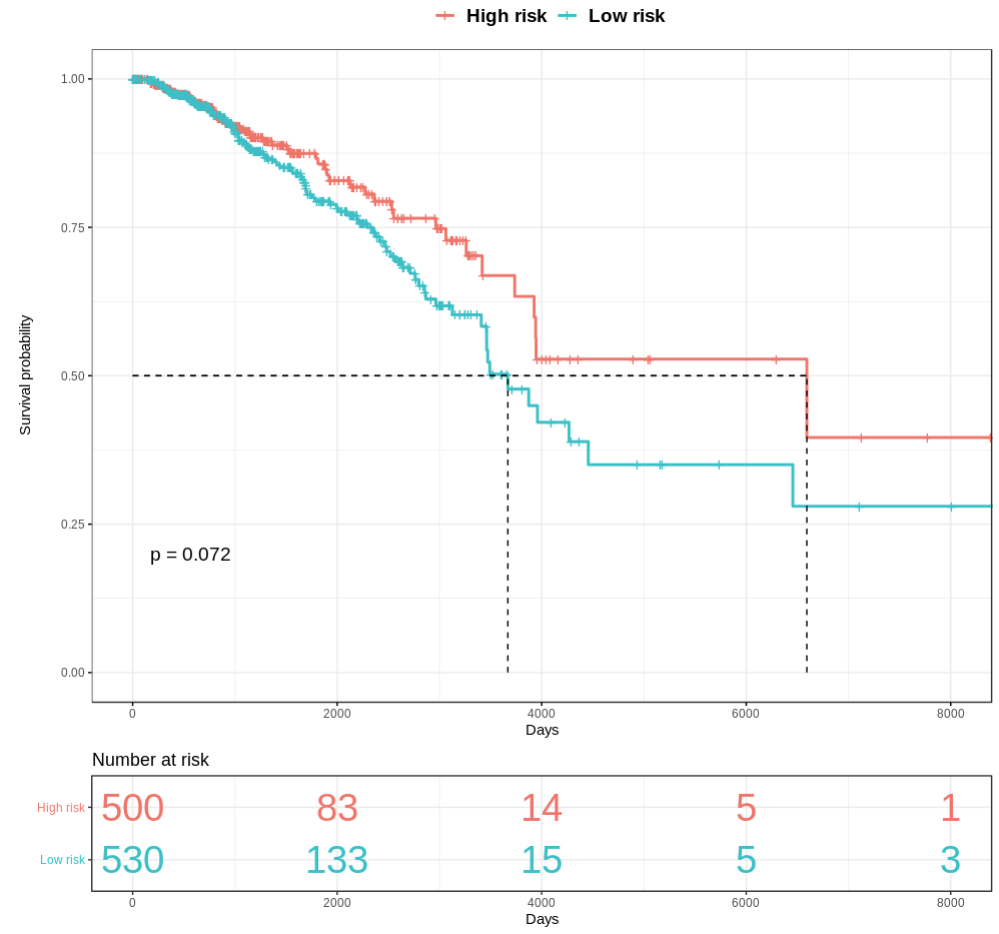
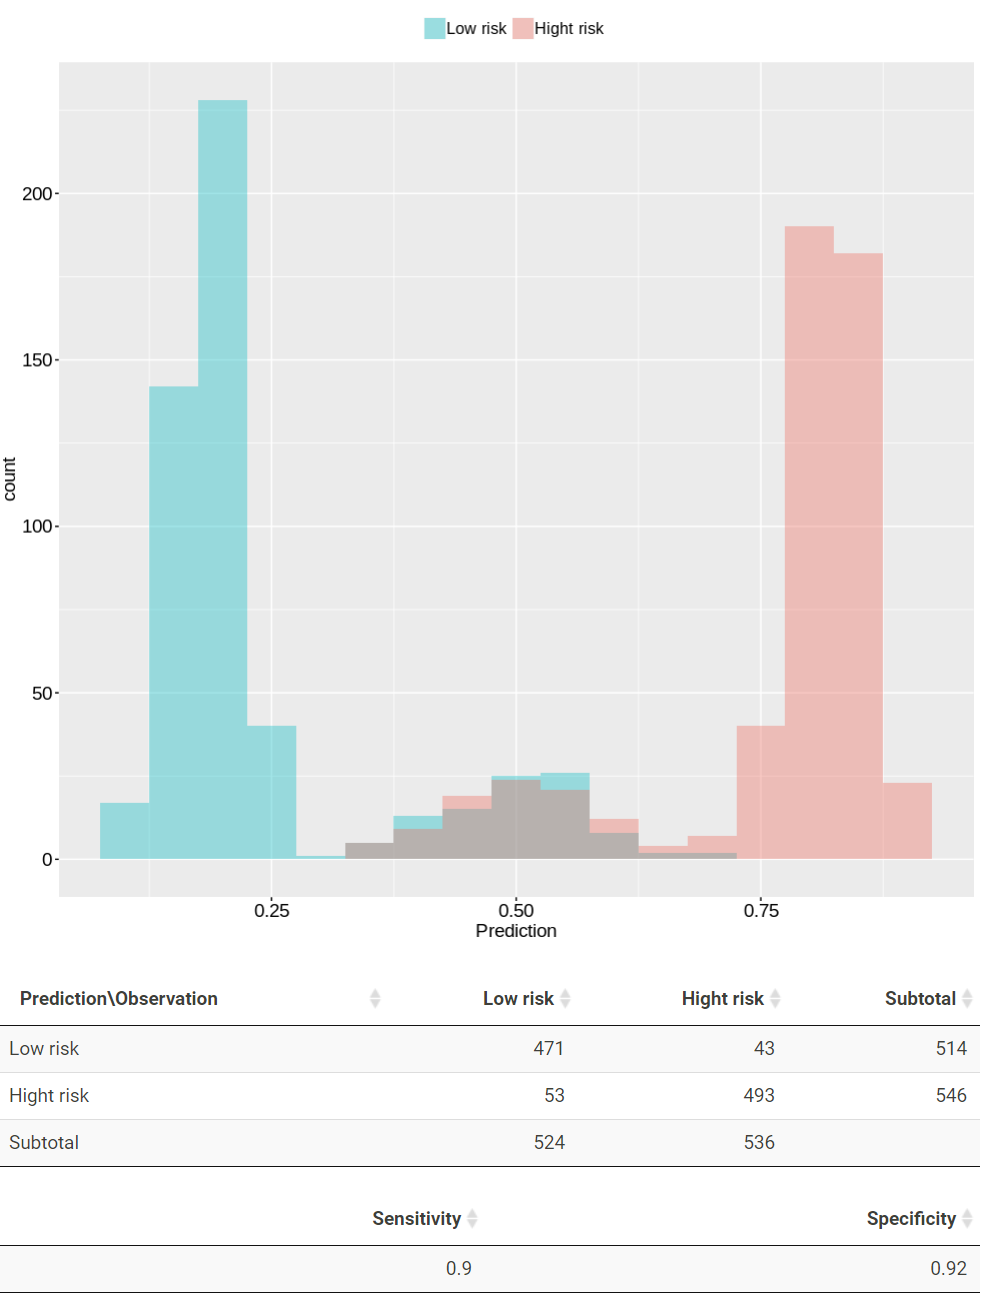
TACCO presents the prediction results in a plot and tables. In the plot, patients with prediction larger than 0.5 are classified as high risk while those lower than 0.5 are classified as low risk. The red and green color represent patients from high risk and low risk, respectively. The confusion matrix, sensitivity and specificity for the prediction results are present in the following table.
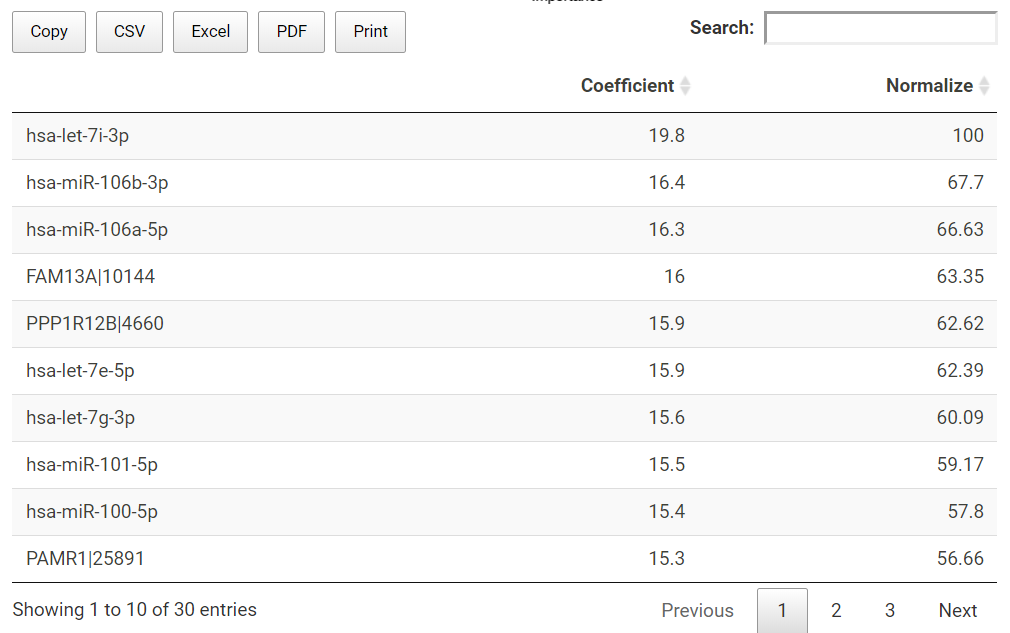
TACCO also presents the prediction model in a table. All the used miRNA or genes (features) together with their slope coefficient and normalized importance are listed in the table.
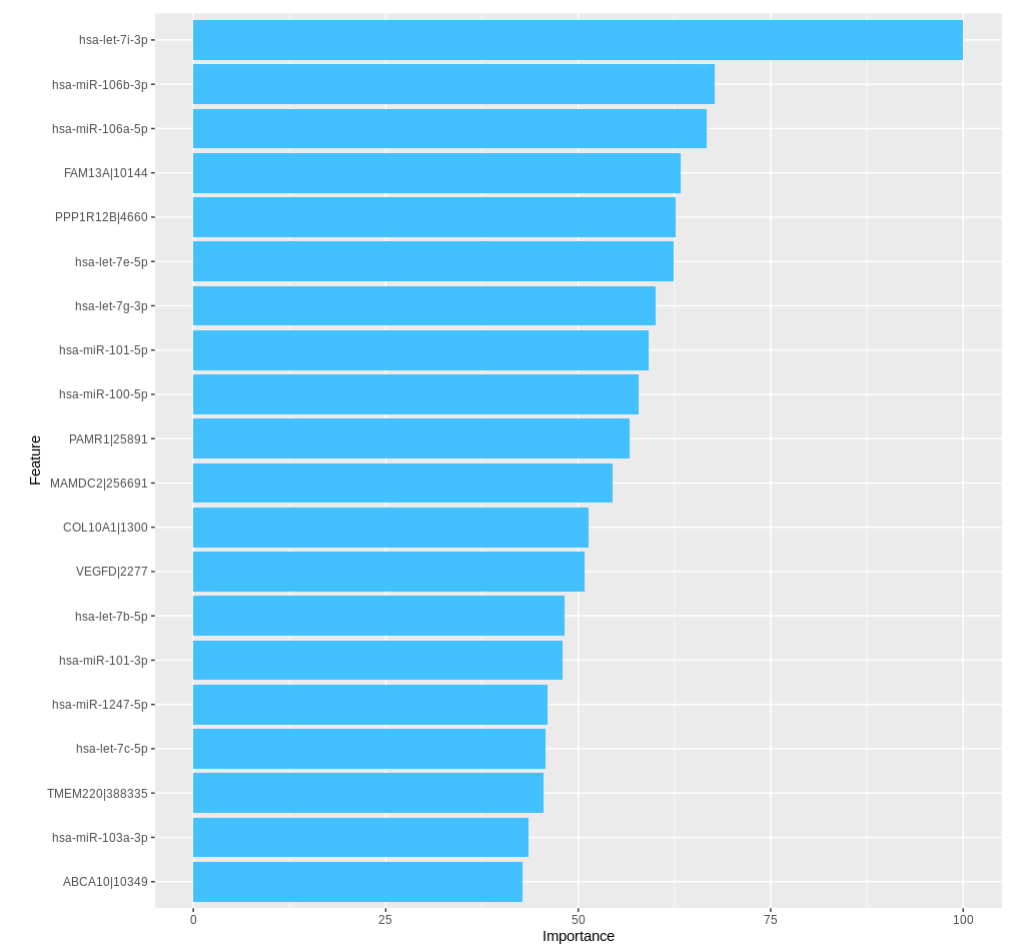
TACCO also presents the importance of the top 20 features in a bar chart.
Stage classification results
TACCO also constructs classification models for cancer stage and TNM stages. TACCO presents the prediction results in plots and tables. In the plot, patients with prediction larger than 0.5 are classified as T1, T2 group while those lower than 0.5 are classified as T3, T4 group. The red and green color represent patients from T1, T2 group and T3, T4 group, respectively. The confusion matrix, sensitivity and specificity for the prediction results are present in the following table.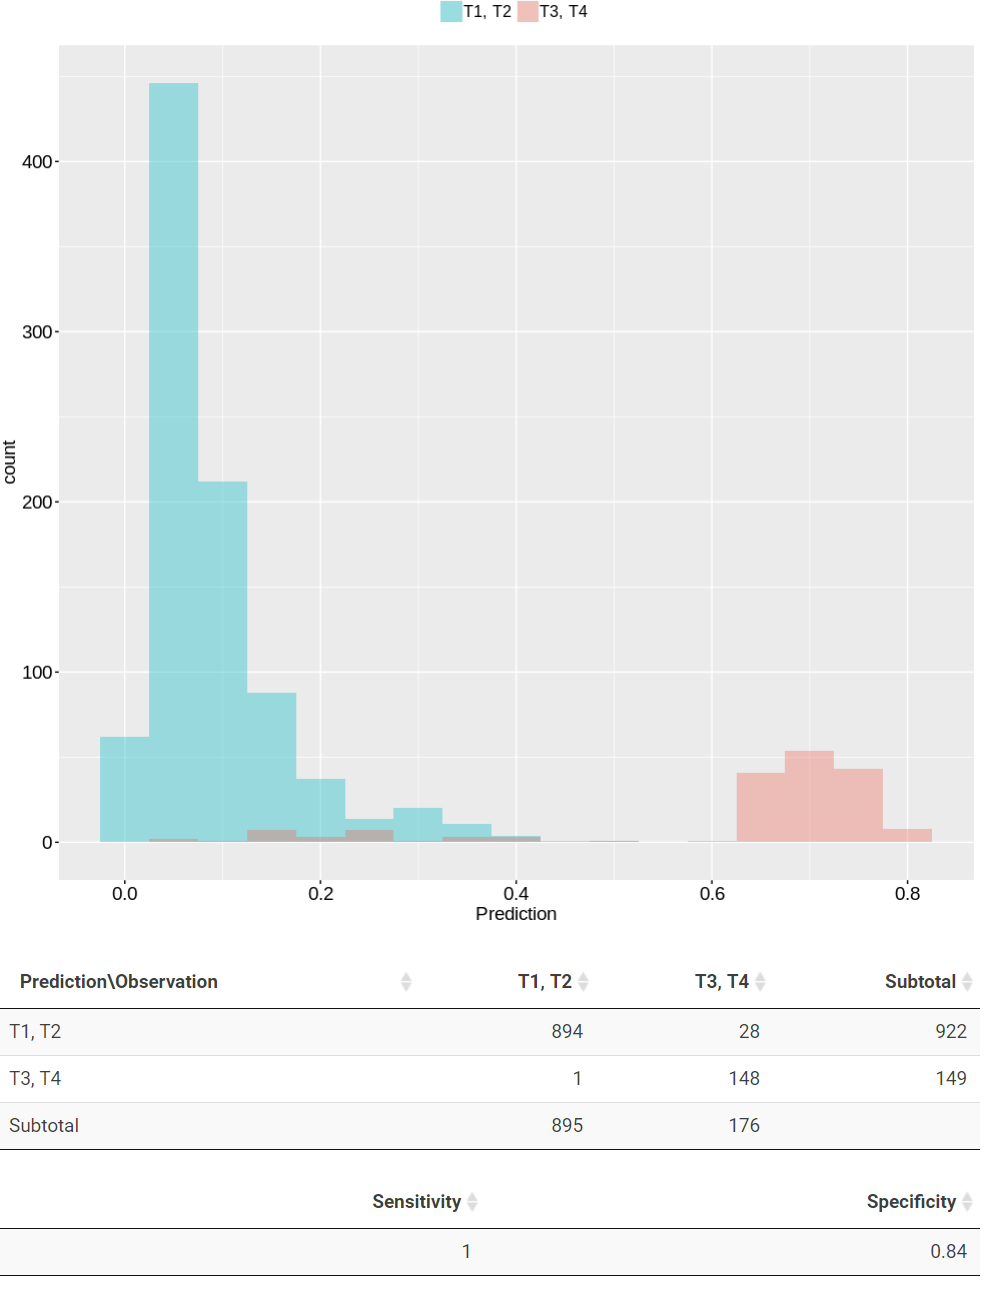
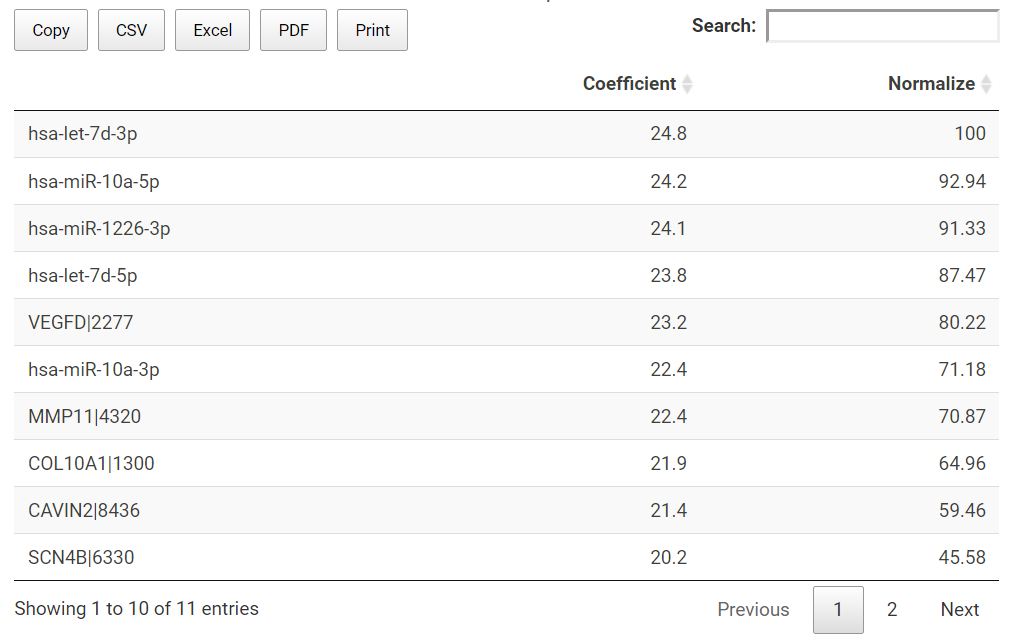
TACCO also presents the prediction model in a table. All the used miRNA or genes (features) together with their slope coefficient and normalized importance are listed in the table.
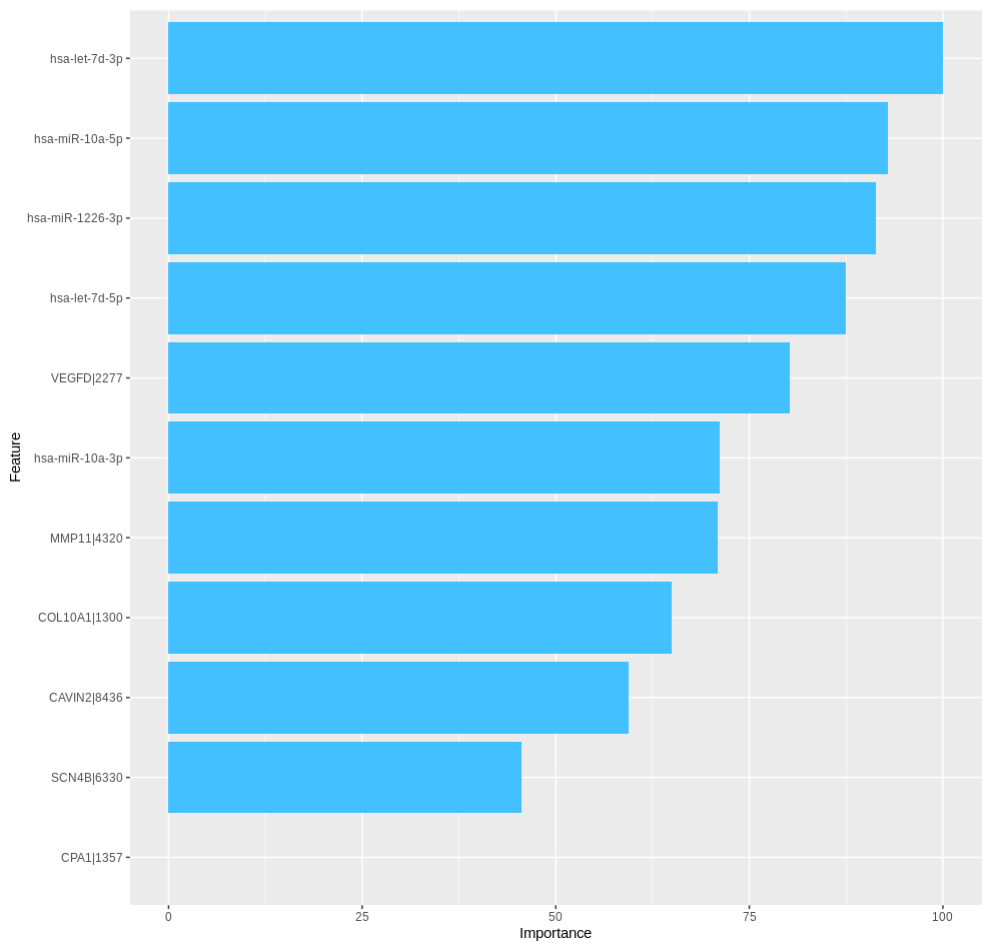
TACCO also presents the importance of the top features in a bar chart (up to 20).
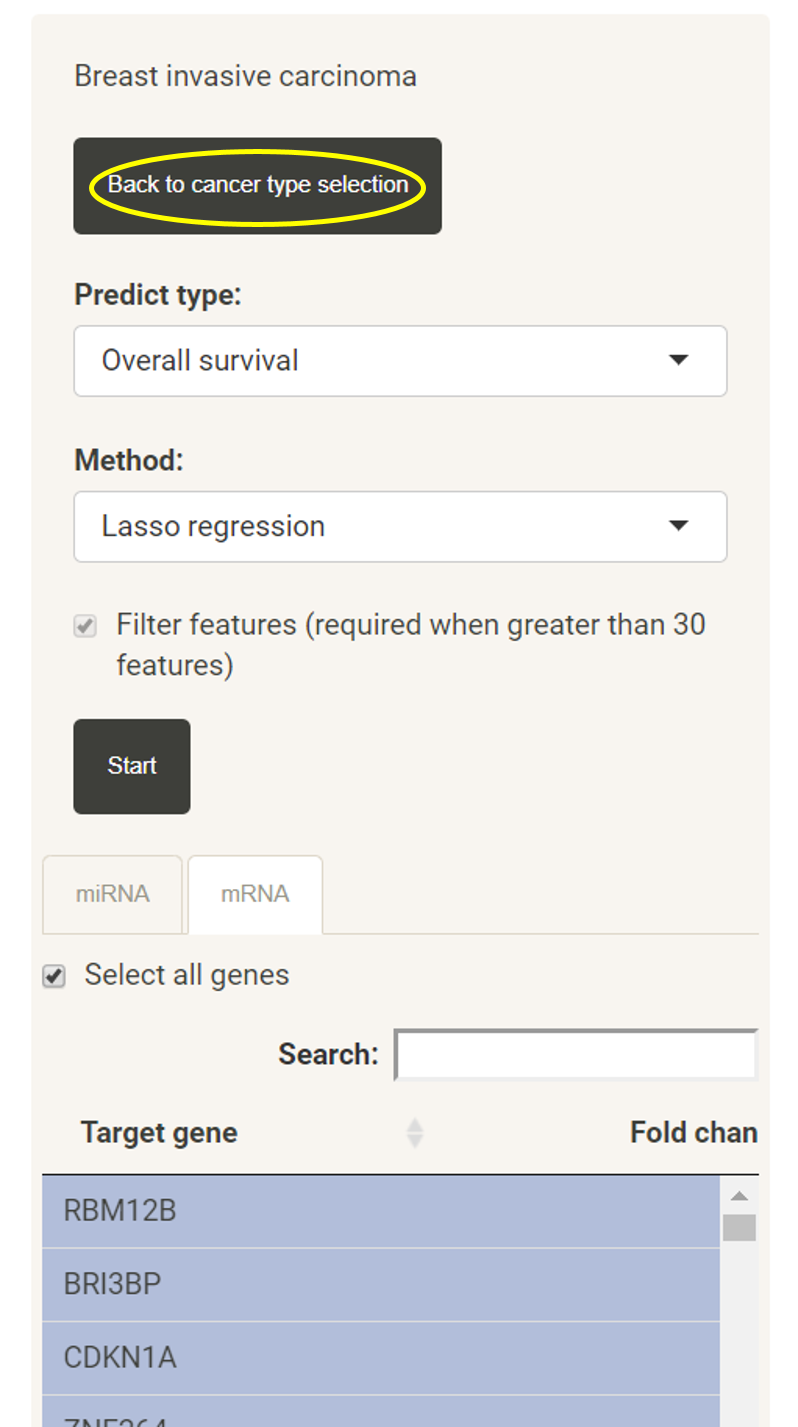
Select another cancer type
Users can also go back to select another cancer type all over again by clicking on "Back to cancer type selection".