Prognosis prediction/cancer stage classification model construction with DEGs
Prepare a list of genes
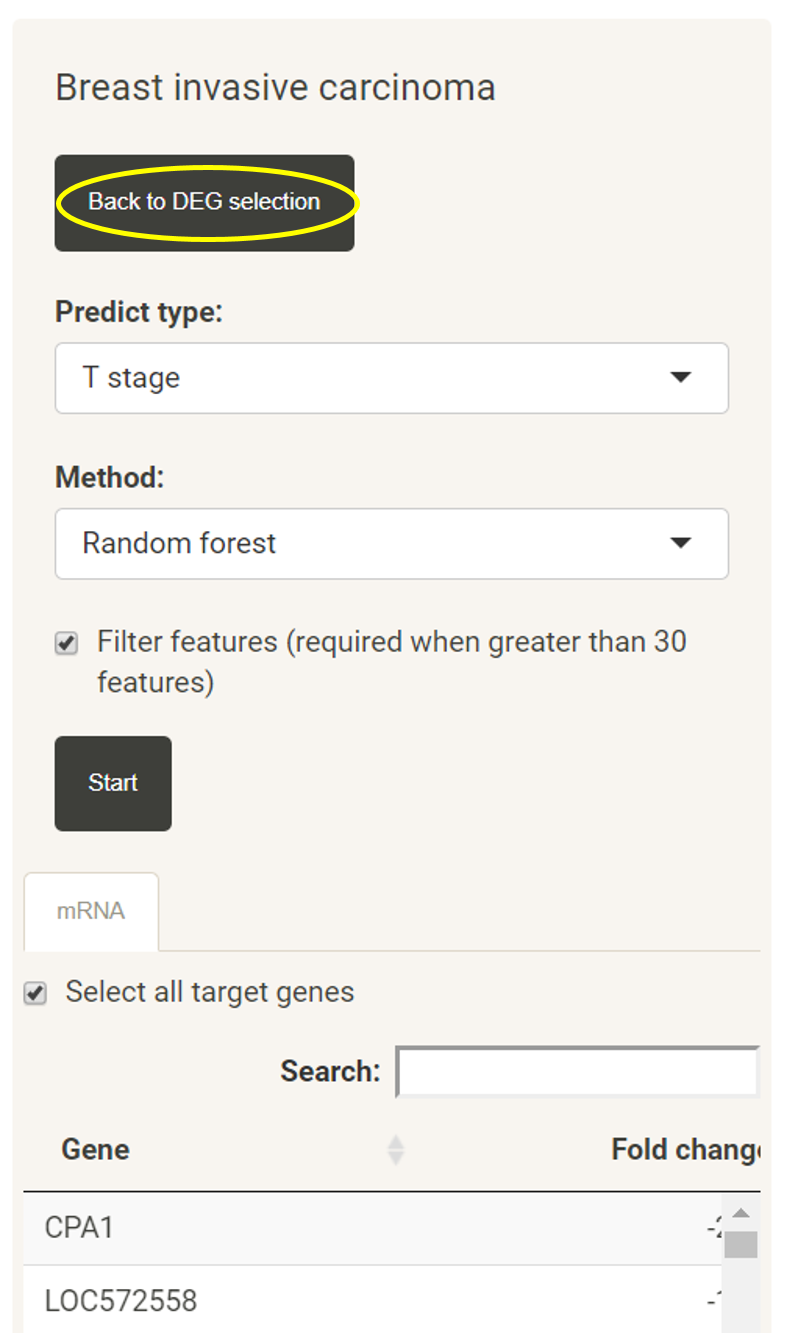
After users have identified a list of DEGs, user can construct a prognosis prediction/cancer stage classification model with these DEGs by clicking "Go to prognosis/stage analysis".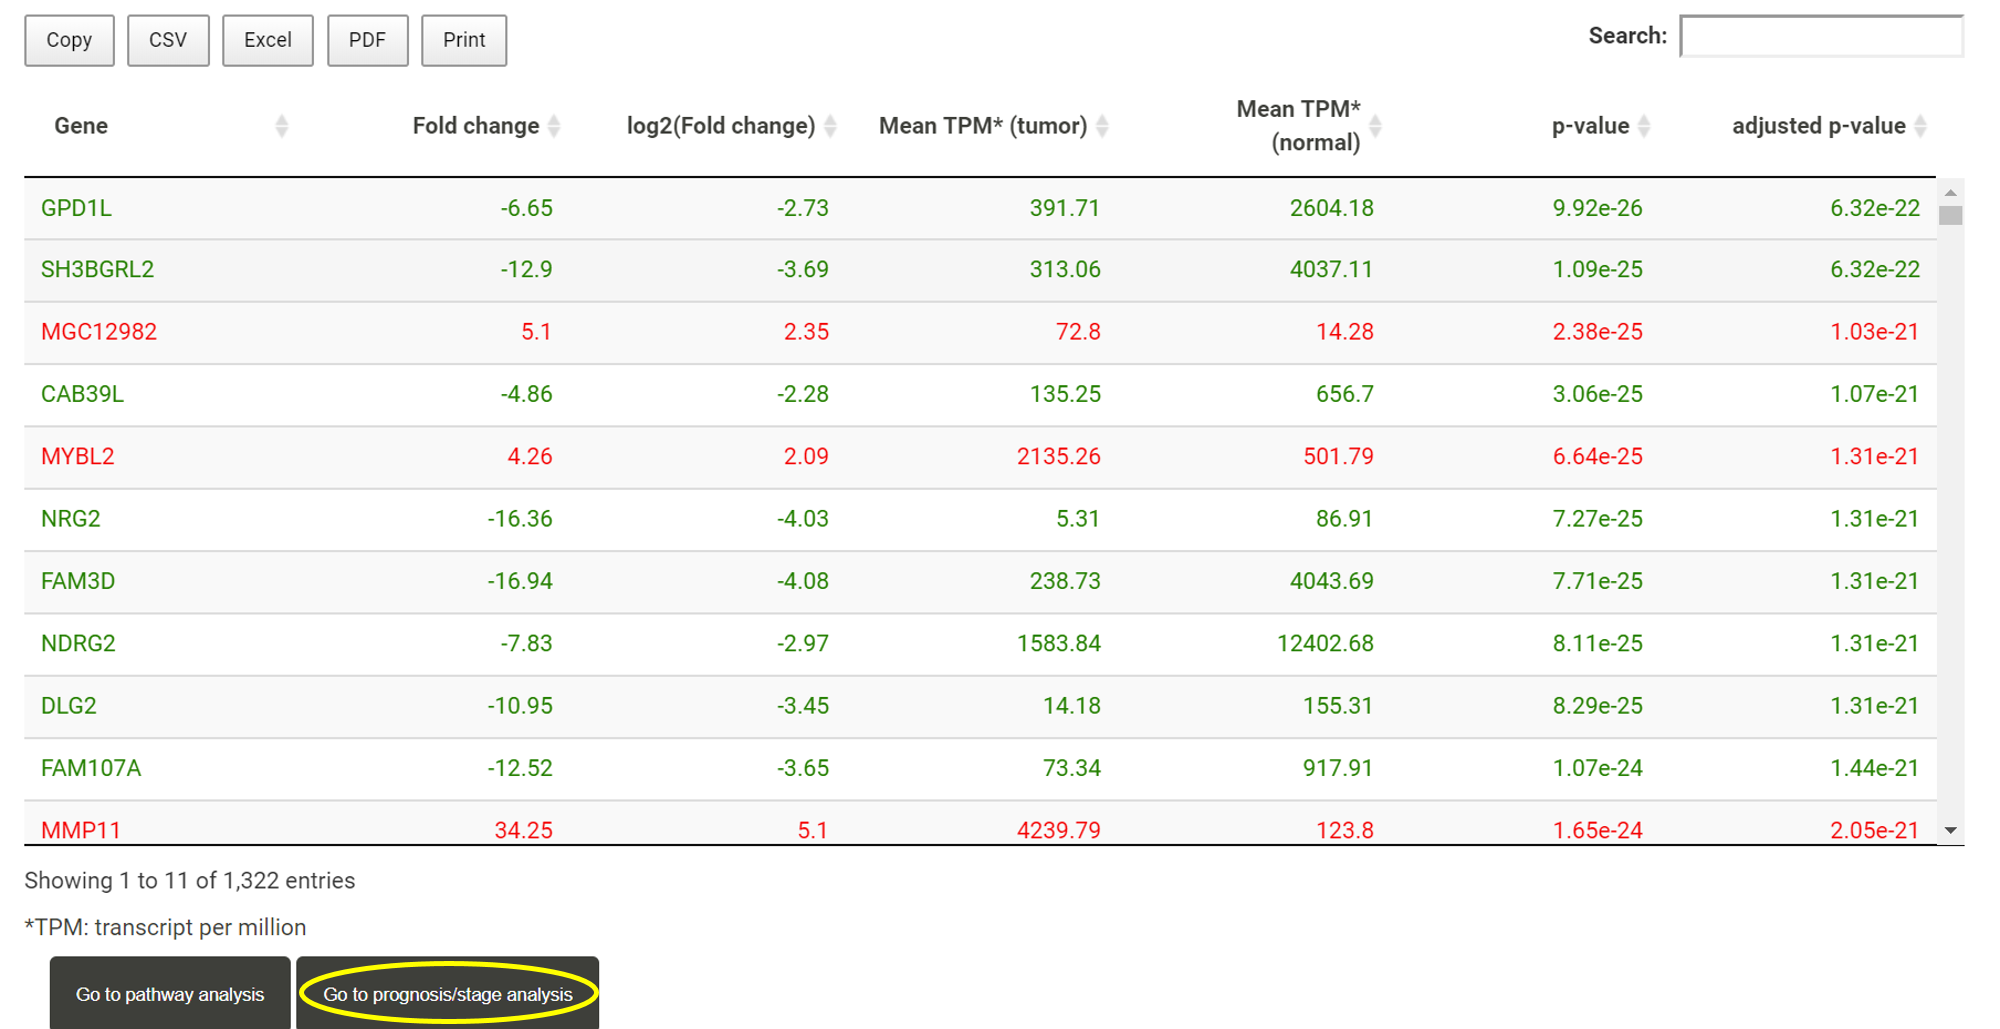
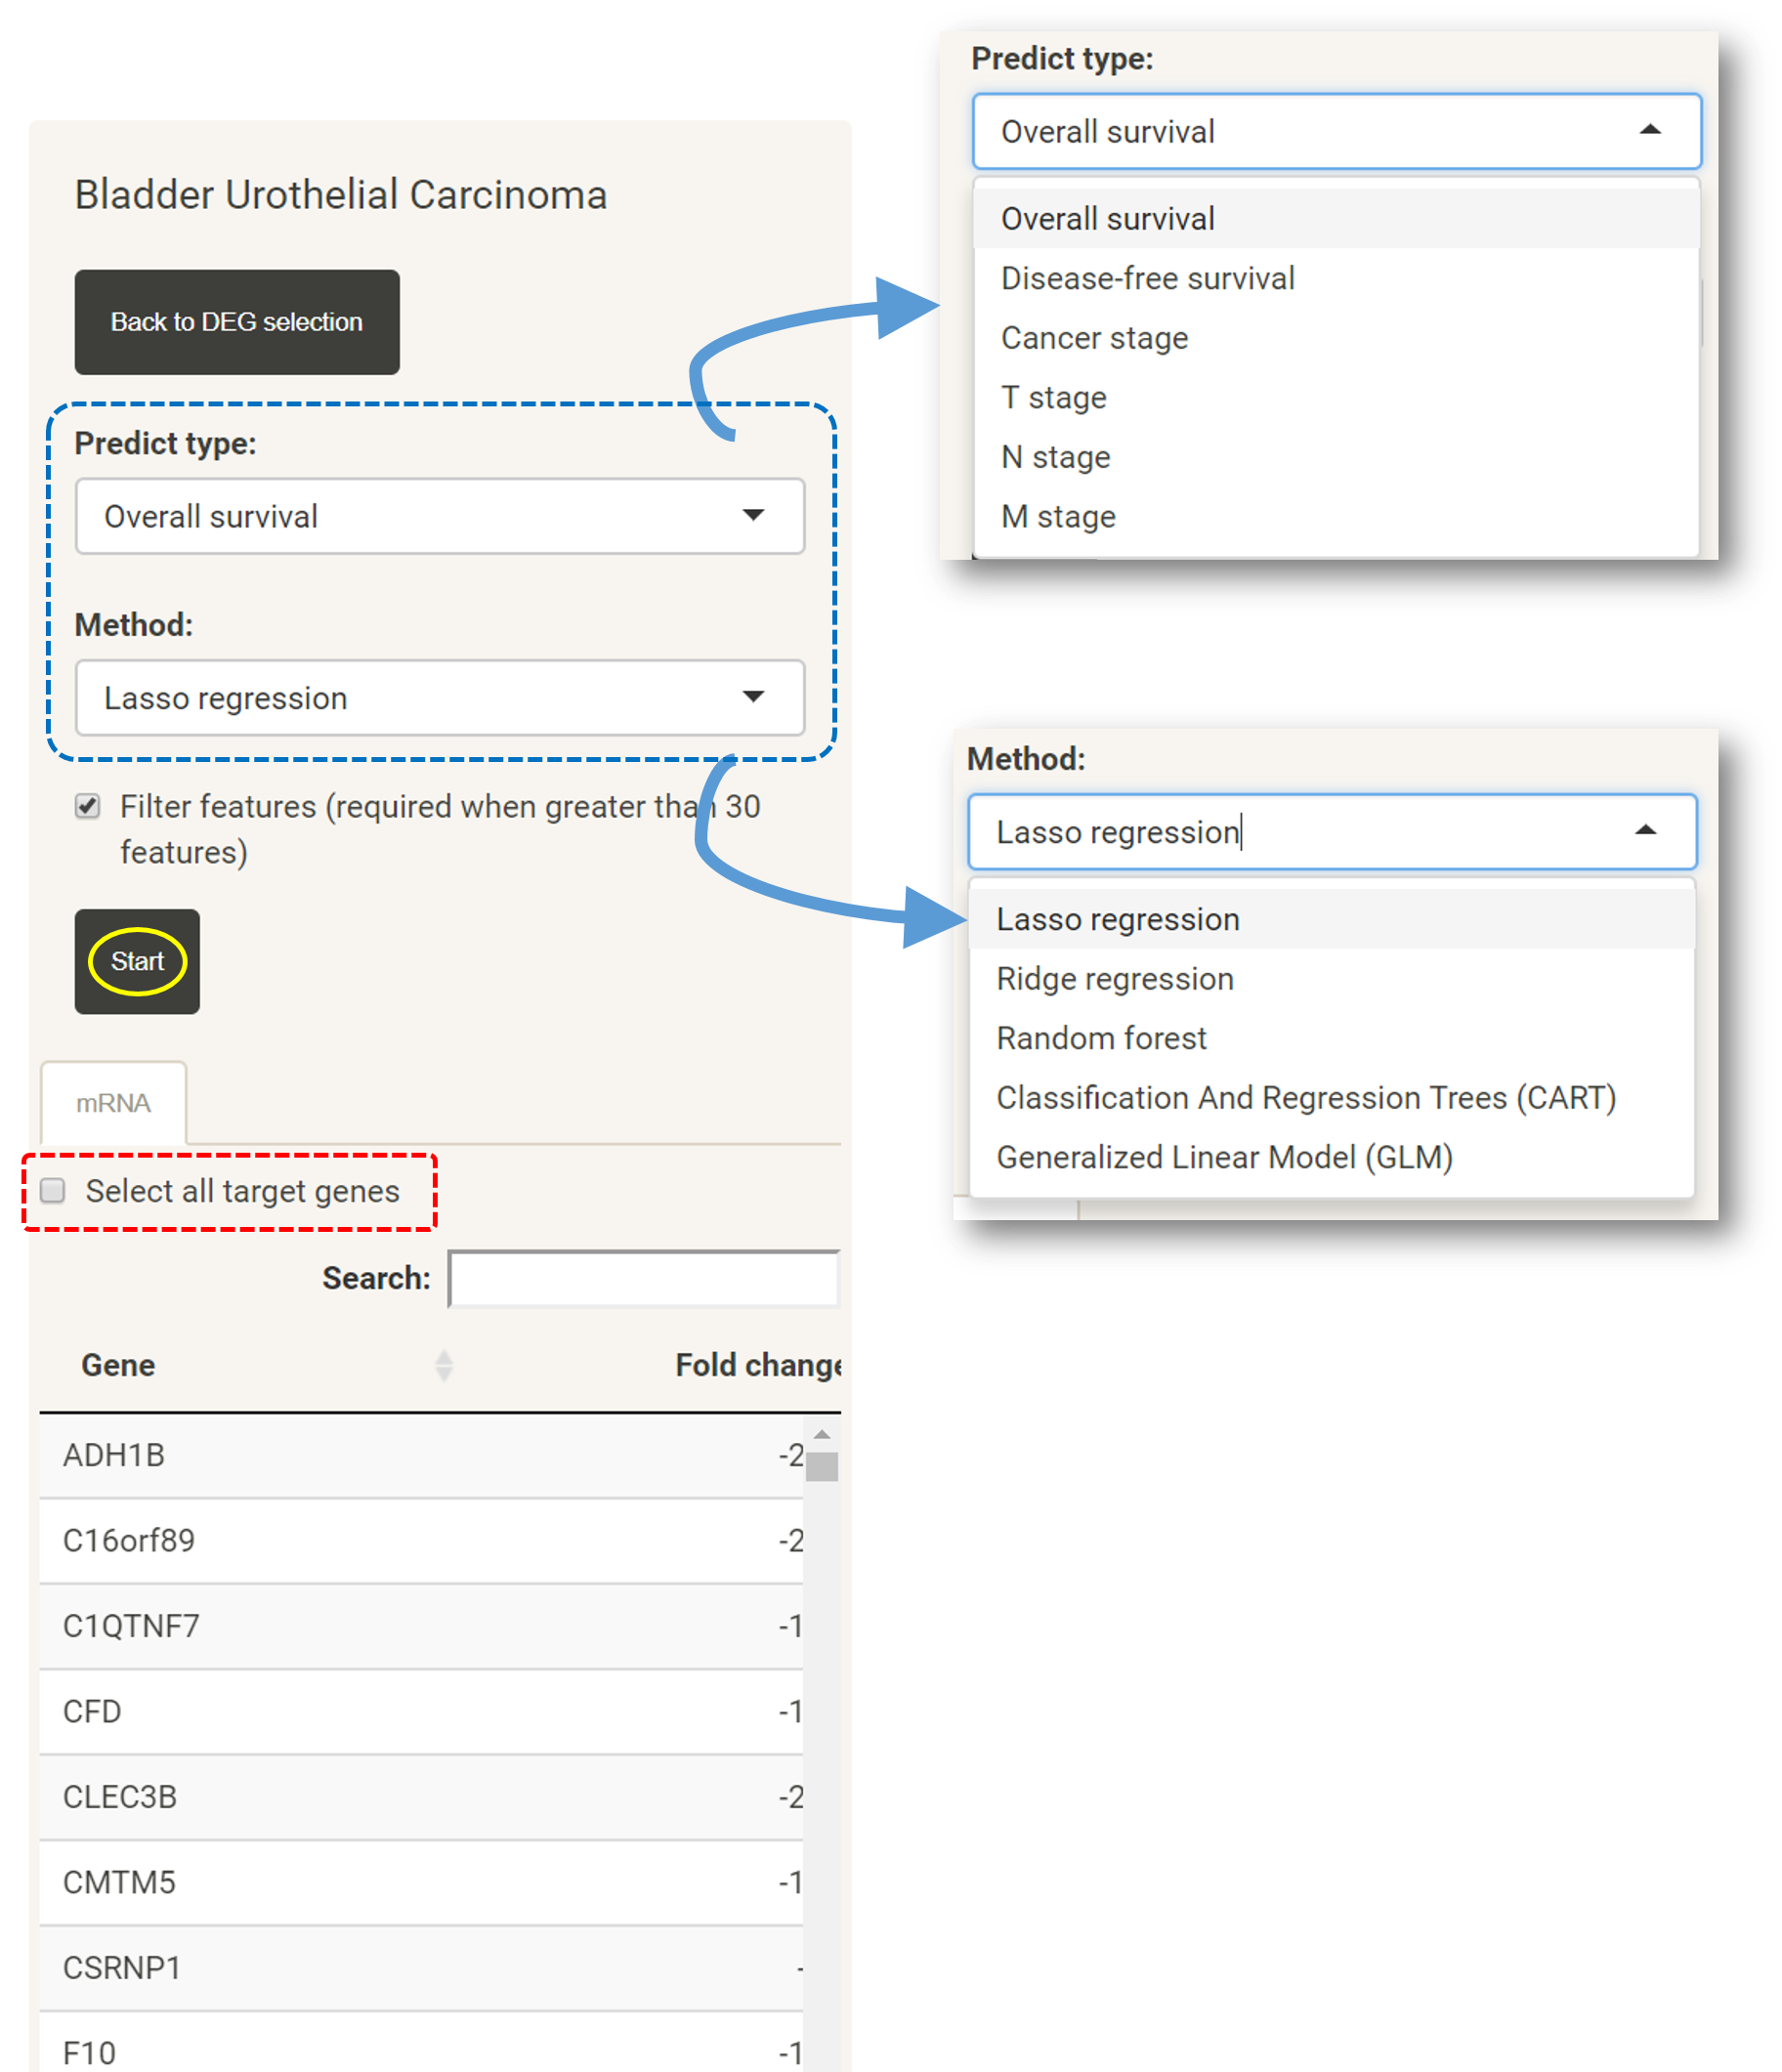
On the prognosis/stage analysis page, users can select all DEGs (the red box) or select a subset of DEGs based on fold change, expression levels or p-values. Users can further select data from a particular survival data/pathological stage and the method they want to use in the model construction (the blue box). TACCO provides both overall survival, disease free survival, cancer stage, T stage, N stage and M stage data for model construction. Utilizing R package caret, TACCO provides methods including Lasso regression, Ridge regression, Random forest, Classification And Regression Tree (CART) and Generalized Linear Model (GLM)*. After specifying all analysis parameters, users can construct prognosis model for prognosis prediction by clicking on "Start".
*GLM is only available when less than 30 features are selected.
Survival analysis results
TACCO constructs a prediction model and tests the prediction results with the log-rank test. The prediction results are shown in a Kaplan-Meier plot. The p-value of log-rank test is shown on the plot. In addition to the Kaplan-Meier plot, TACCO also lists the number of patients at risk for different time points.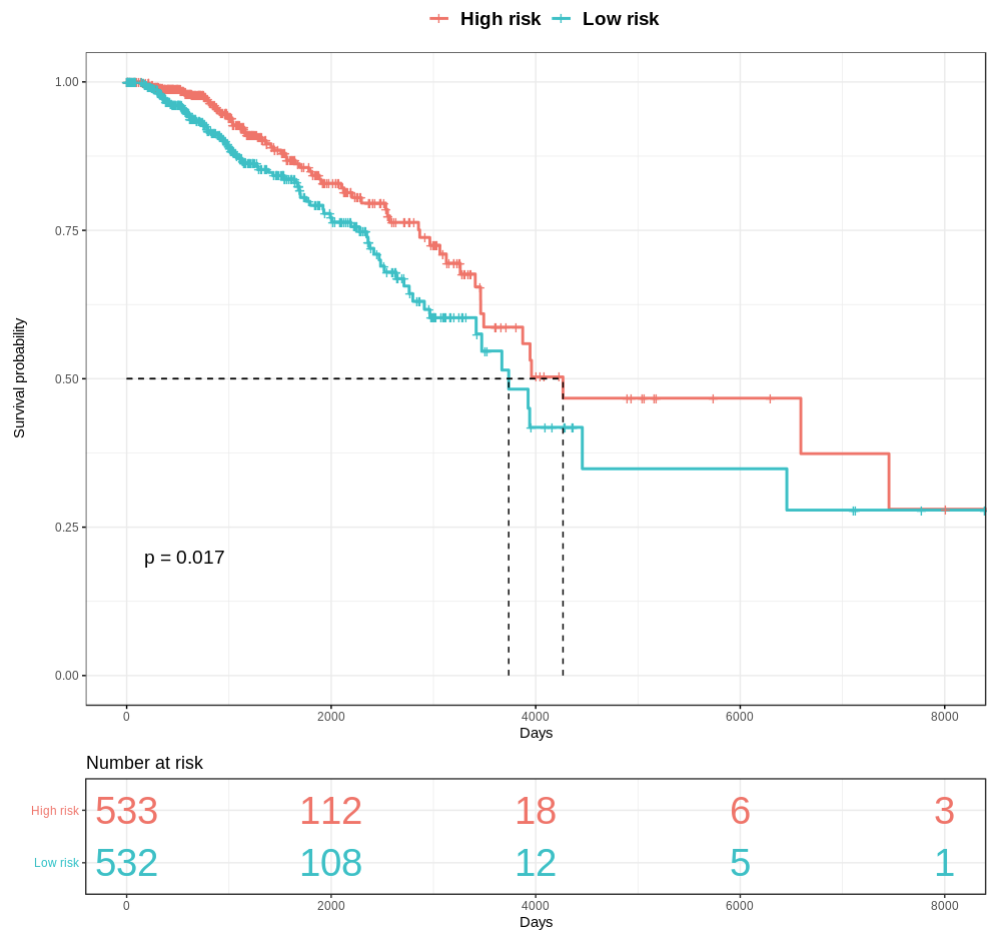
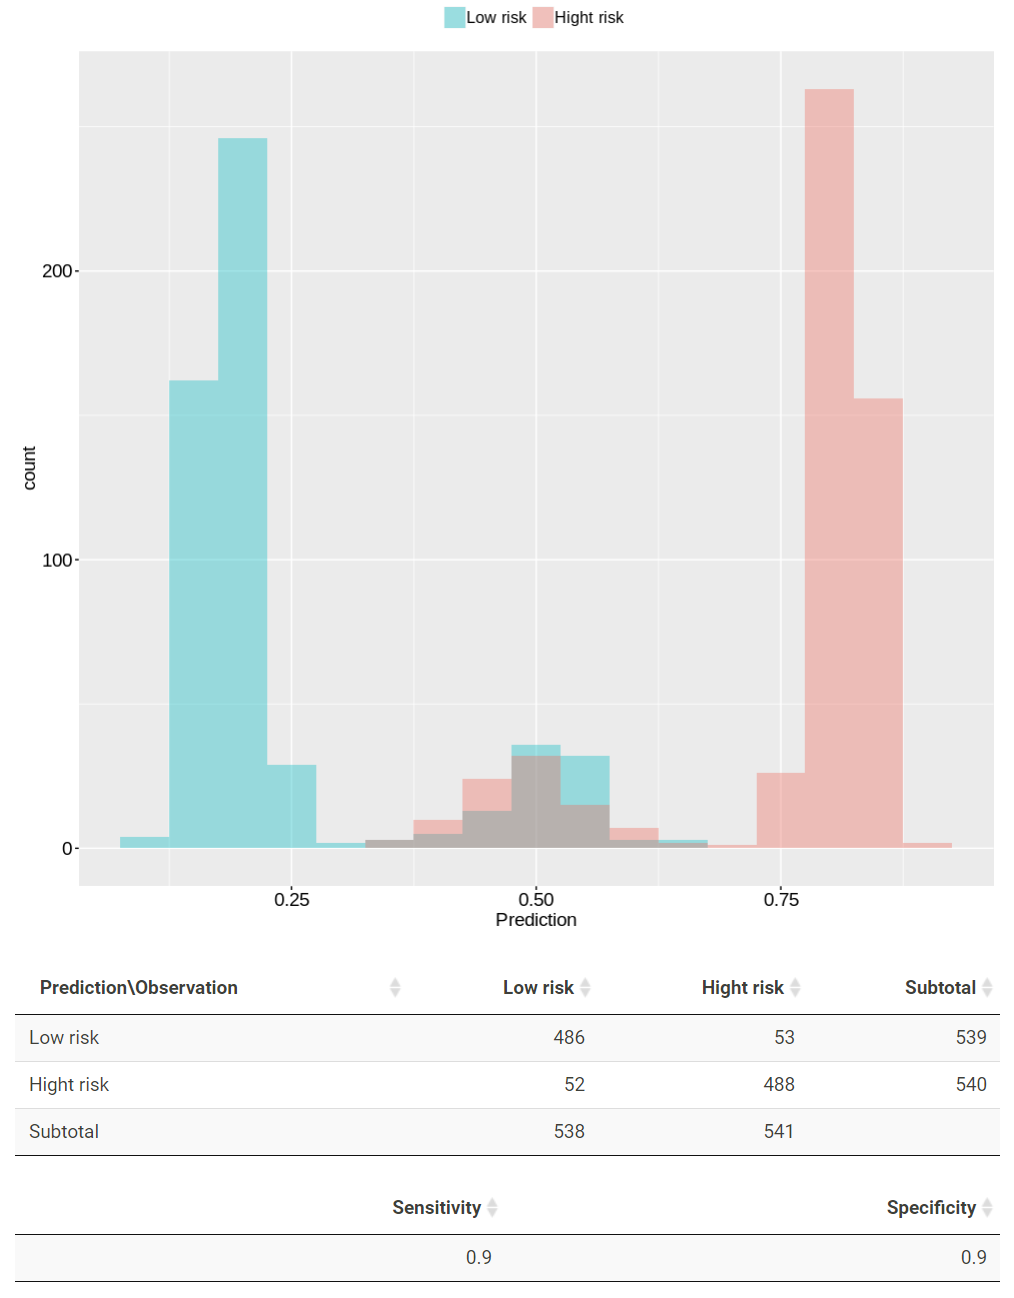
TACCO presents the prediction results in a plot and tables. In the plot, patients with prediction larger than 0.5 are classified as high risk while those lower than 0.5 are classified as low risk. The red and green color represent patients from high risk and low risk, respectively. The confusion matrix, sensitivity and specificity for the prediction results are present in the following table.
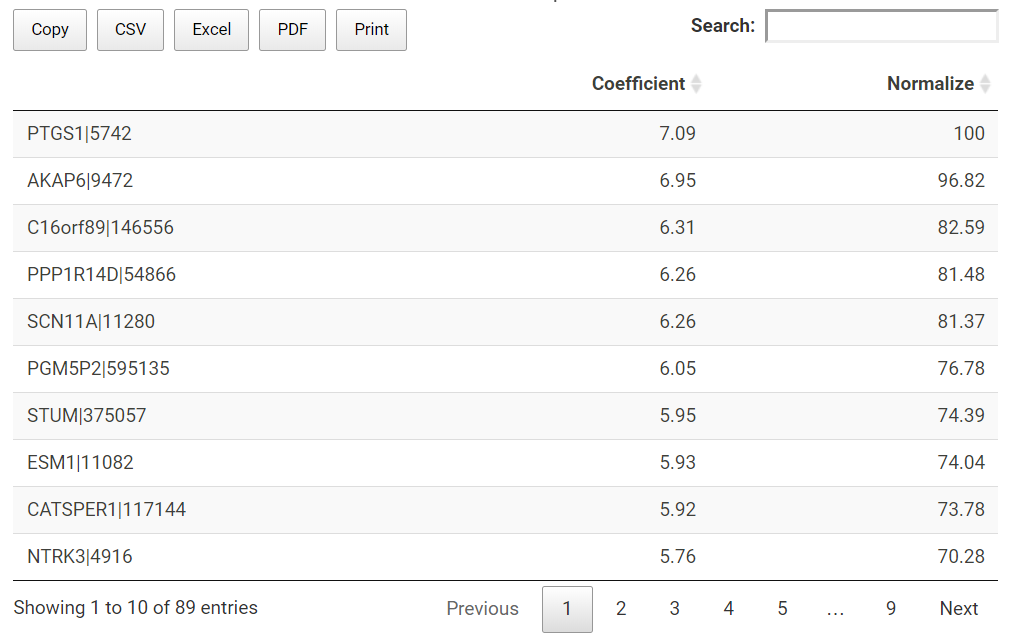
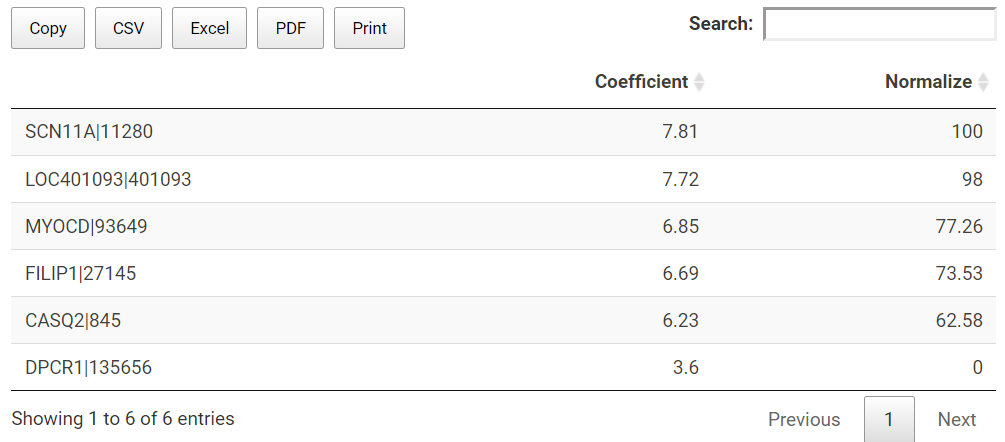
TACCO also presents the prediction model in a table. All the used genes (features) together with their slope coefficient and normalized importance are listed in the table.
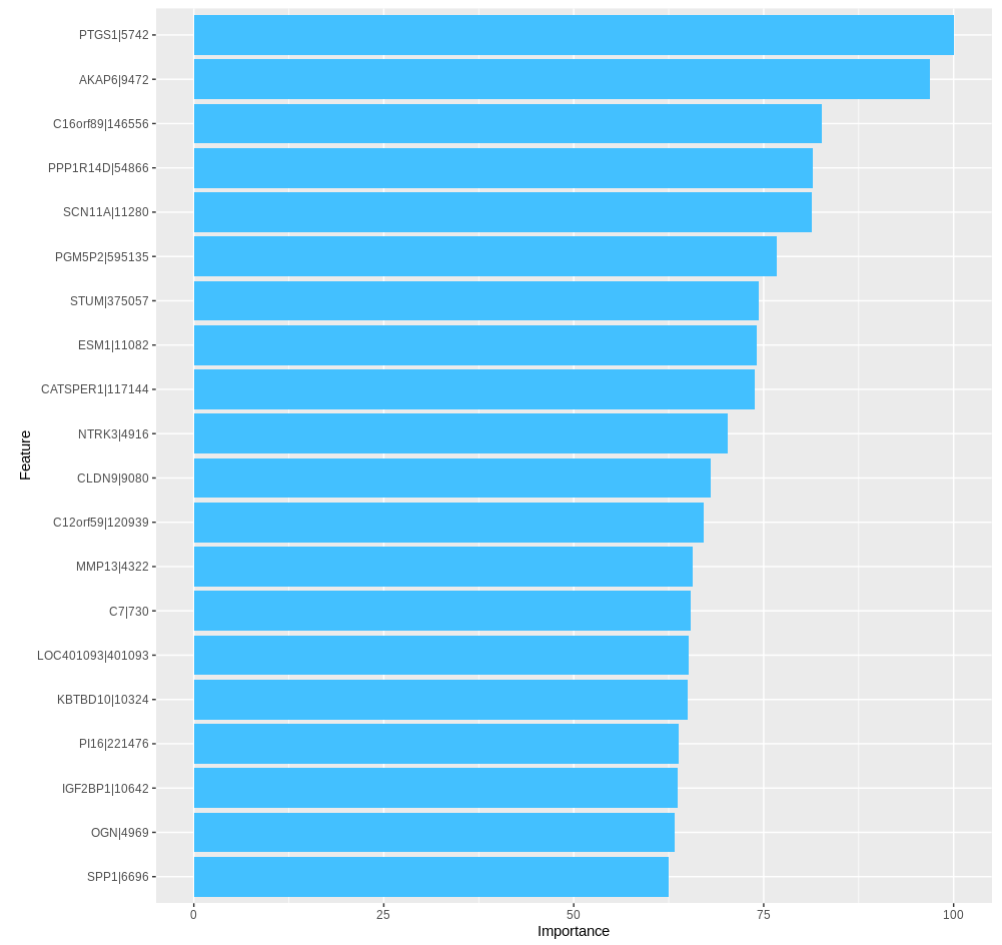
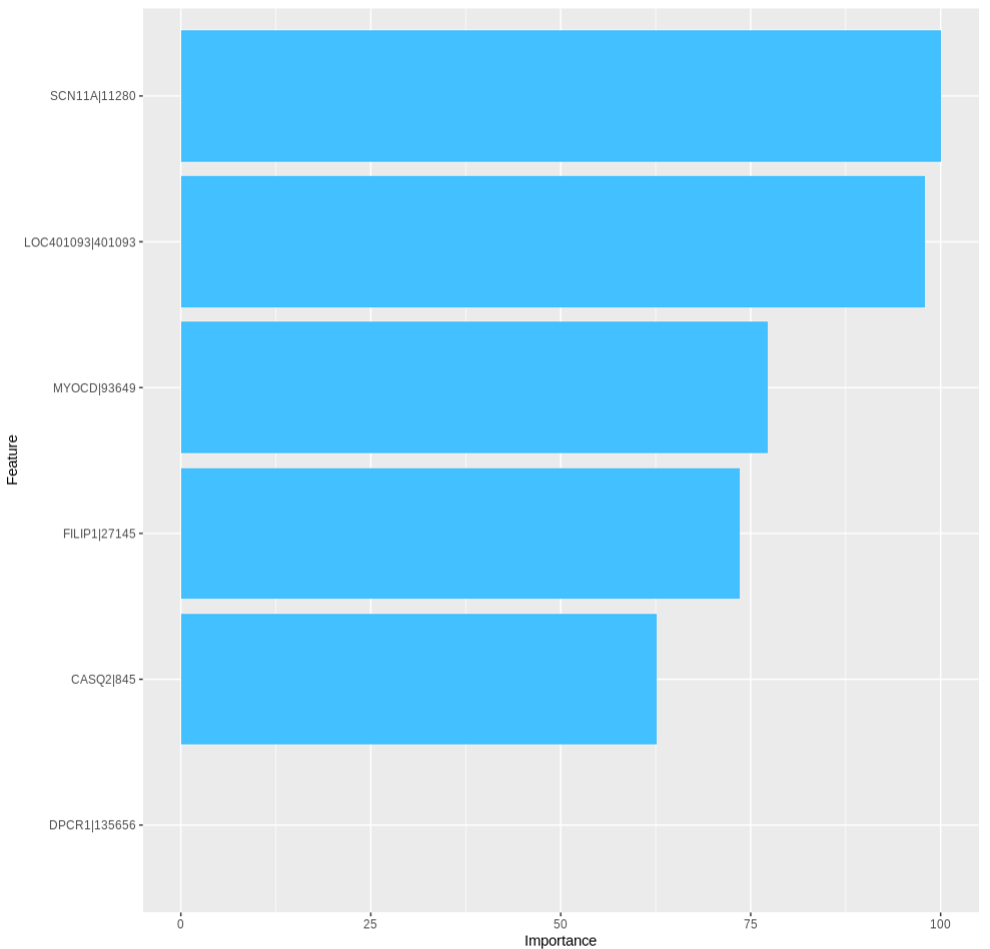
TACCO also presents the importance of the top 20 features in a bar chart.
Stage classification results
TACCO also constructs classification models for cancer stage and TNM stages. TACCO presents the prediction results in plots and tables. In the following example prediction plot, patients with prediction larger than 0.5 are classified as M1 group while those lower than 0.5 are classified as M0 group. The red and green color represent patients from M1 and M0 groups, respectively. The confusion matrix, sensitivity and specificity for the prediction results are present in the following table.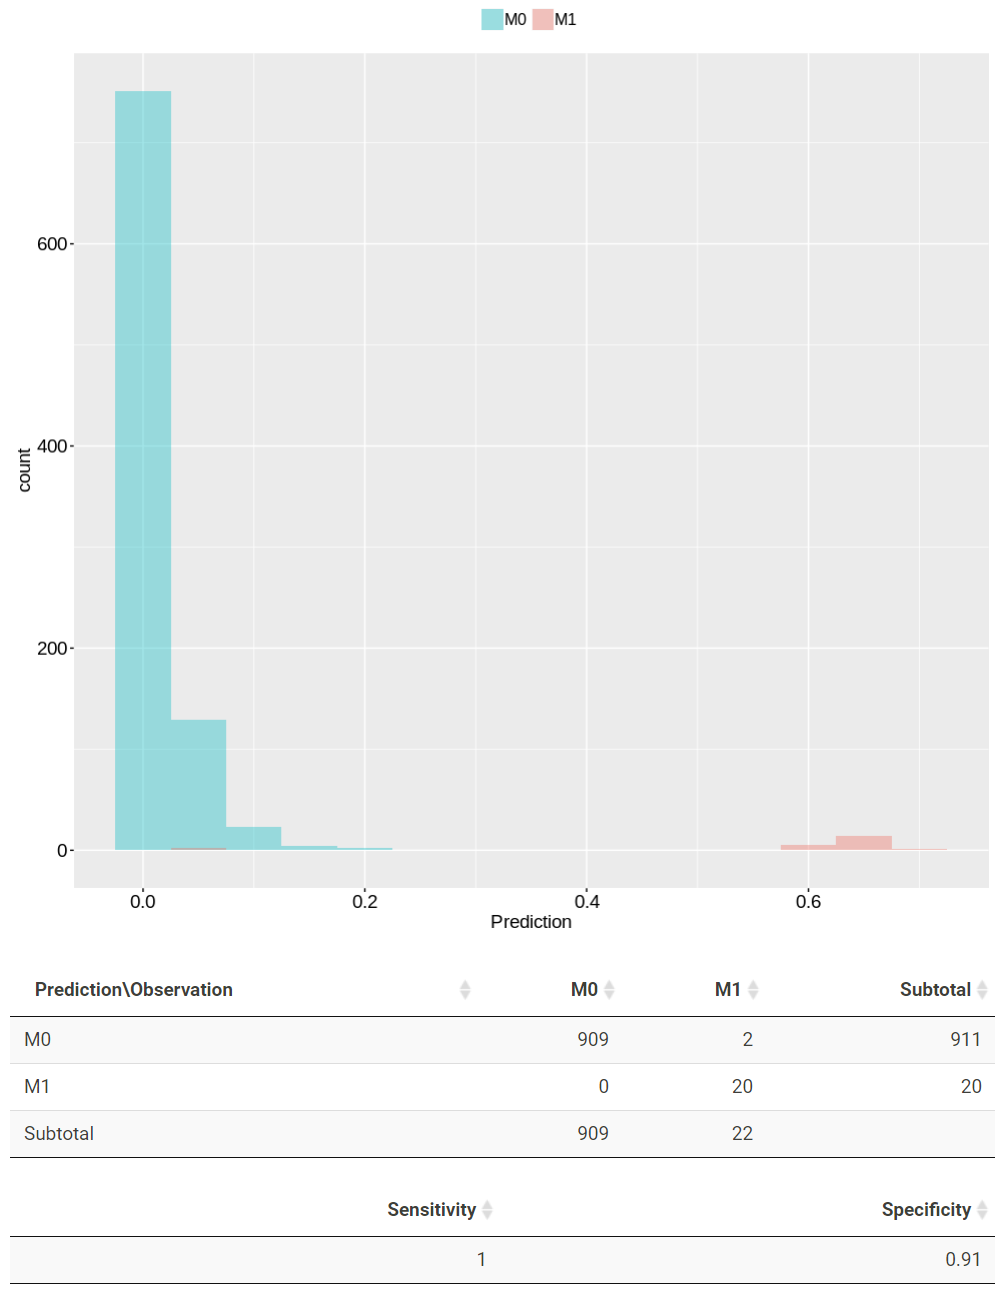
TACCO also presents the prediction model in a table. All the used genes (features) together with their slope coefficient and normalized importance are listed in the table.
TACCO also presents the importance of the top features in a bar chart (up to 20).
Select another list of genes
Users can also go back to select DEGs all over again by clicking on "Back to DEG selection".