GO analysis with target genes for uploaded miRNAs
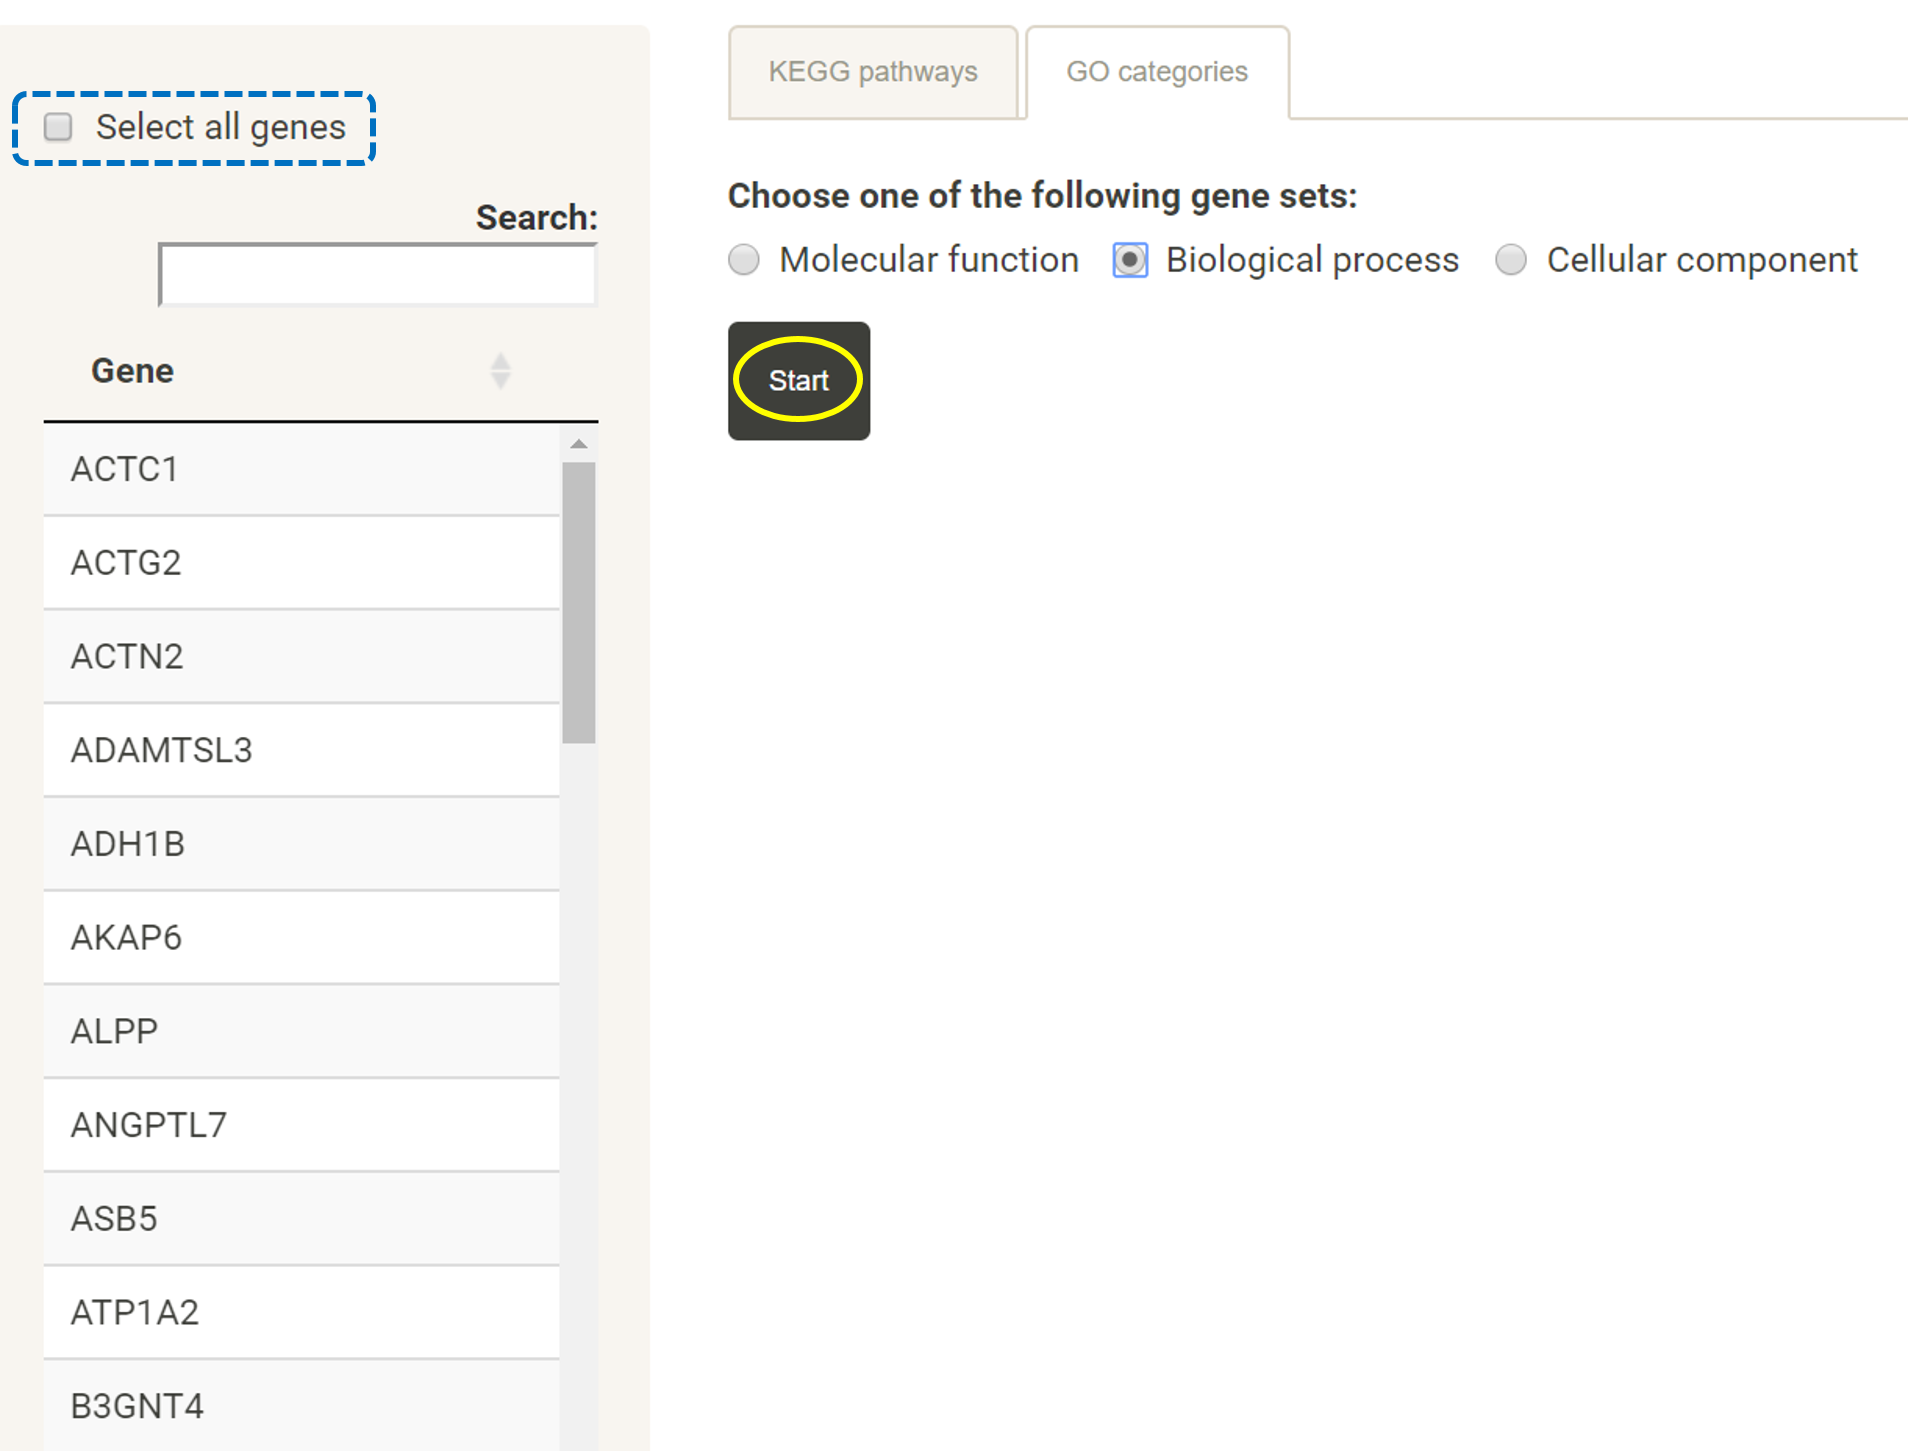
Prepare a list of genes
After users have uploaded a list of miRNAs, users can first browse the expression levels of these gene in different cancer types in TACCO. Users can select a cancer type and the expression levels, fold changes and p-values for the uploaded miRANs or their target genes in that cancer type will be listed in the table. Users can click on "Go to pathway analysis".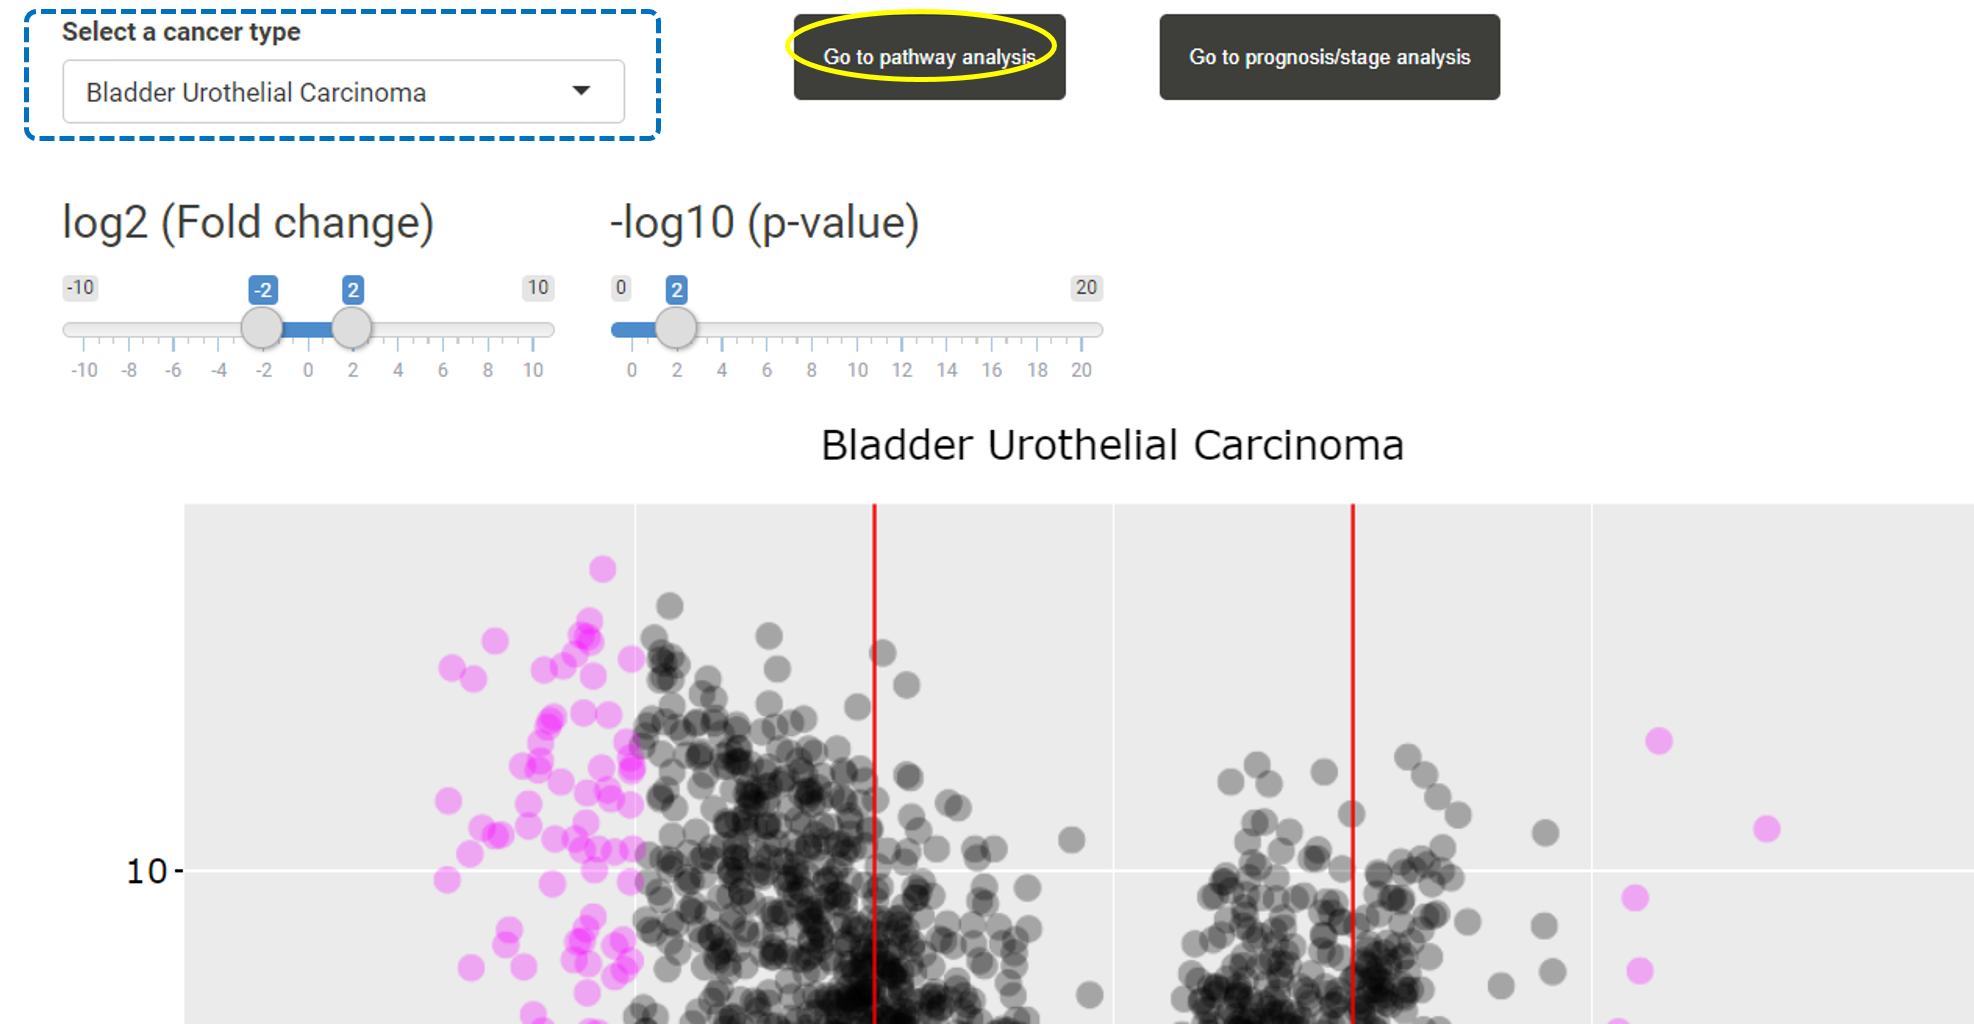
GO enrichment results
TACCO provides the gene ratio distribution plot for enriched GO terms. Users can download, zoom in, zoom out or reset the plot.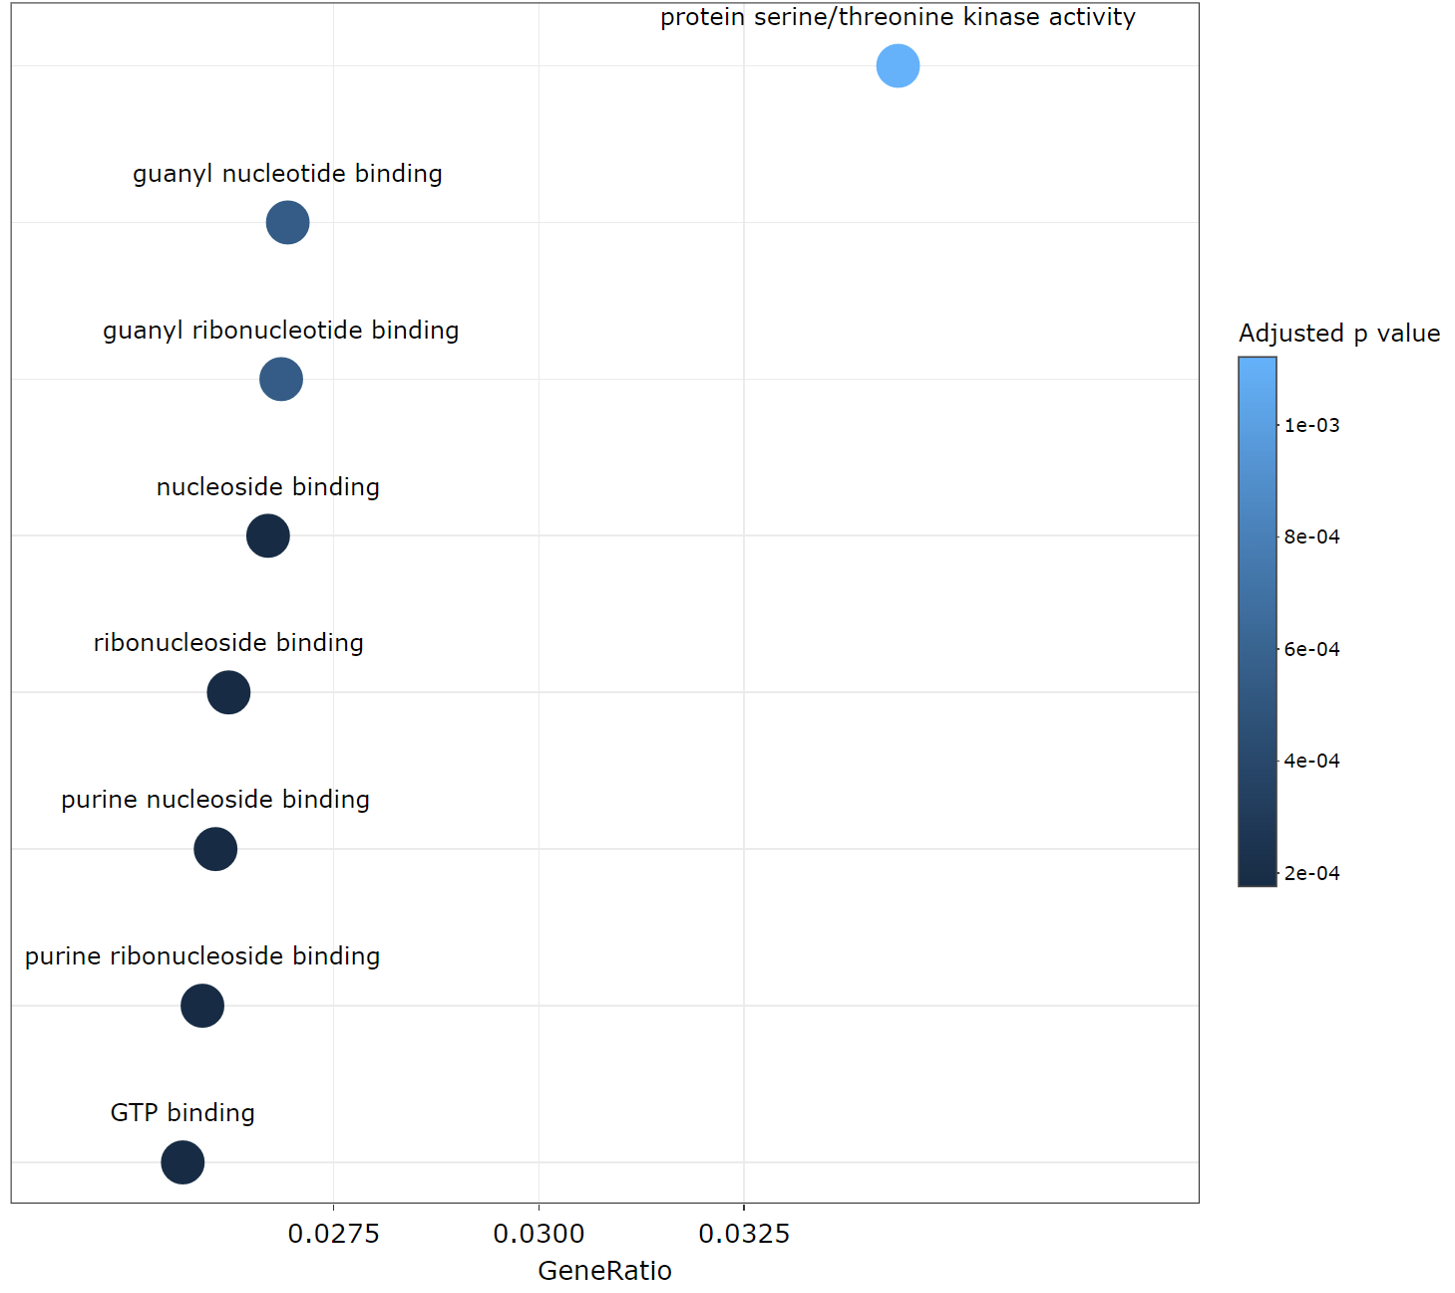
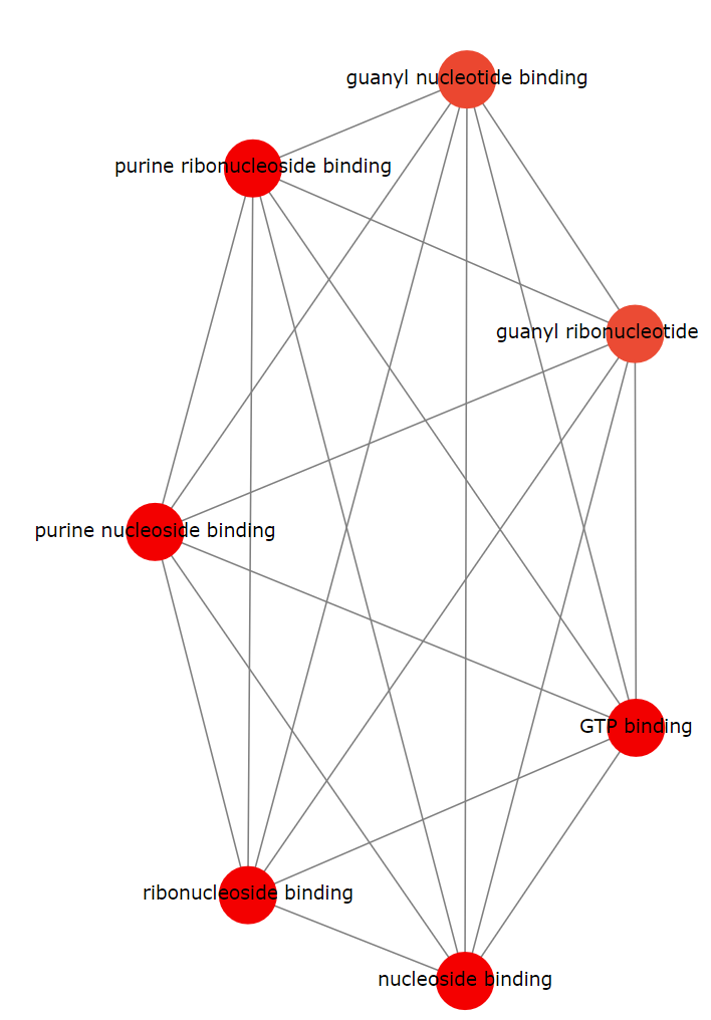
TACCO also provides the connected network plot for enriched GO terms. Pathways sharing the same gene(s) are connected in the network plot. Users can also download, zoom in, zoom out or reset the plot.
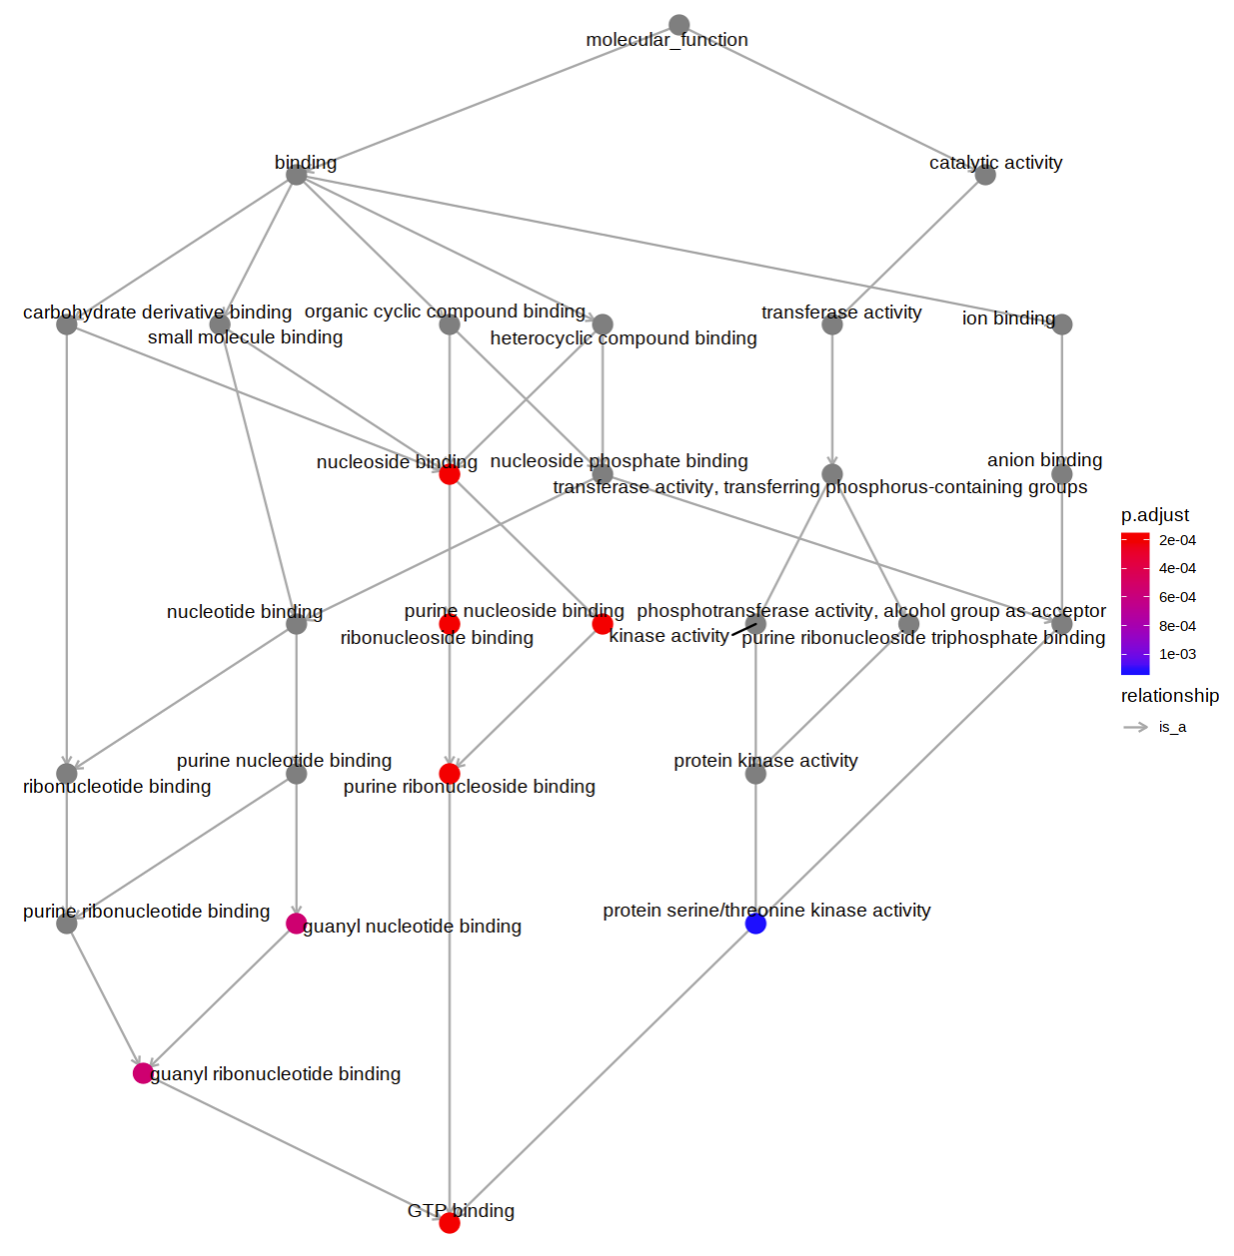
A directed acyclic graph presents the relationship between enriched GO terms is also generated.
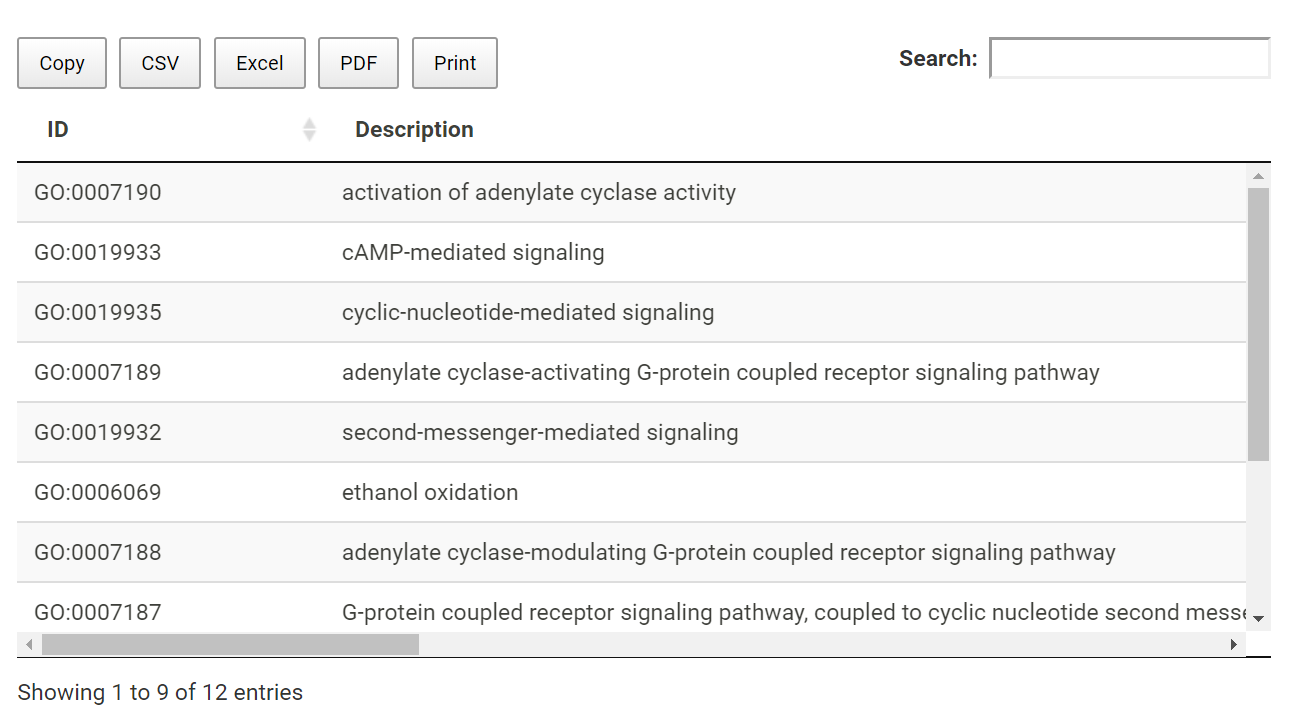
Detailed information for GO enrichment analysis is listed in table. Users can download the table.