Identify DEmiRNAs
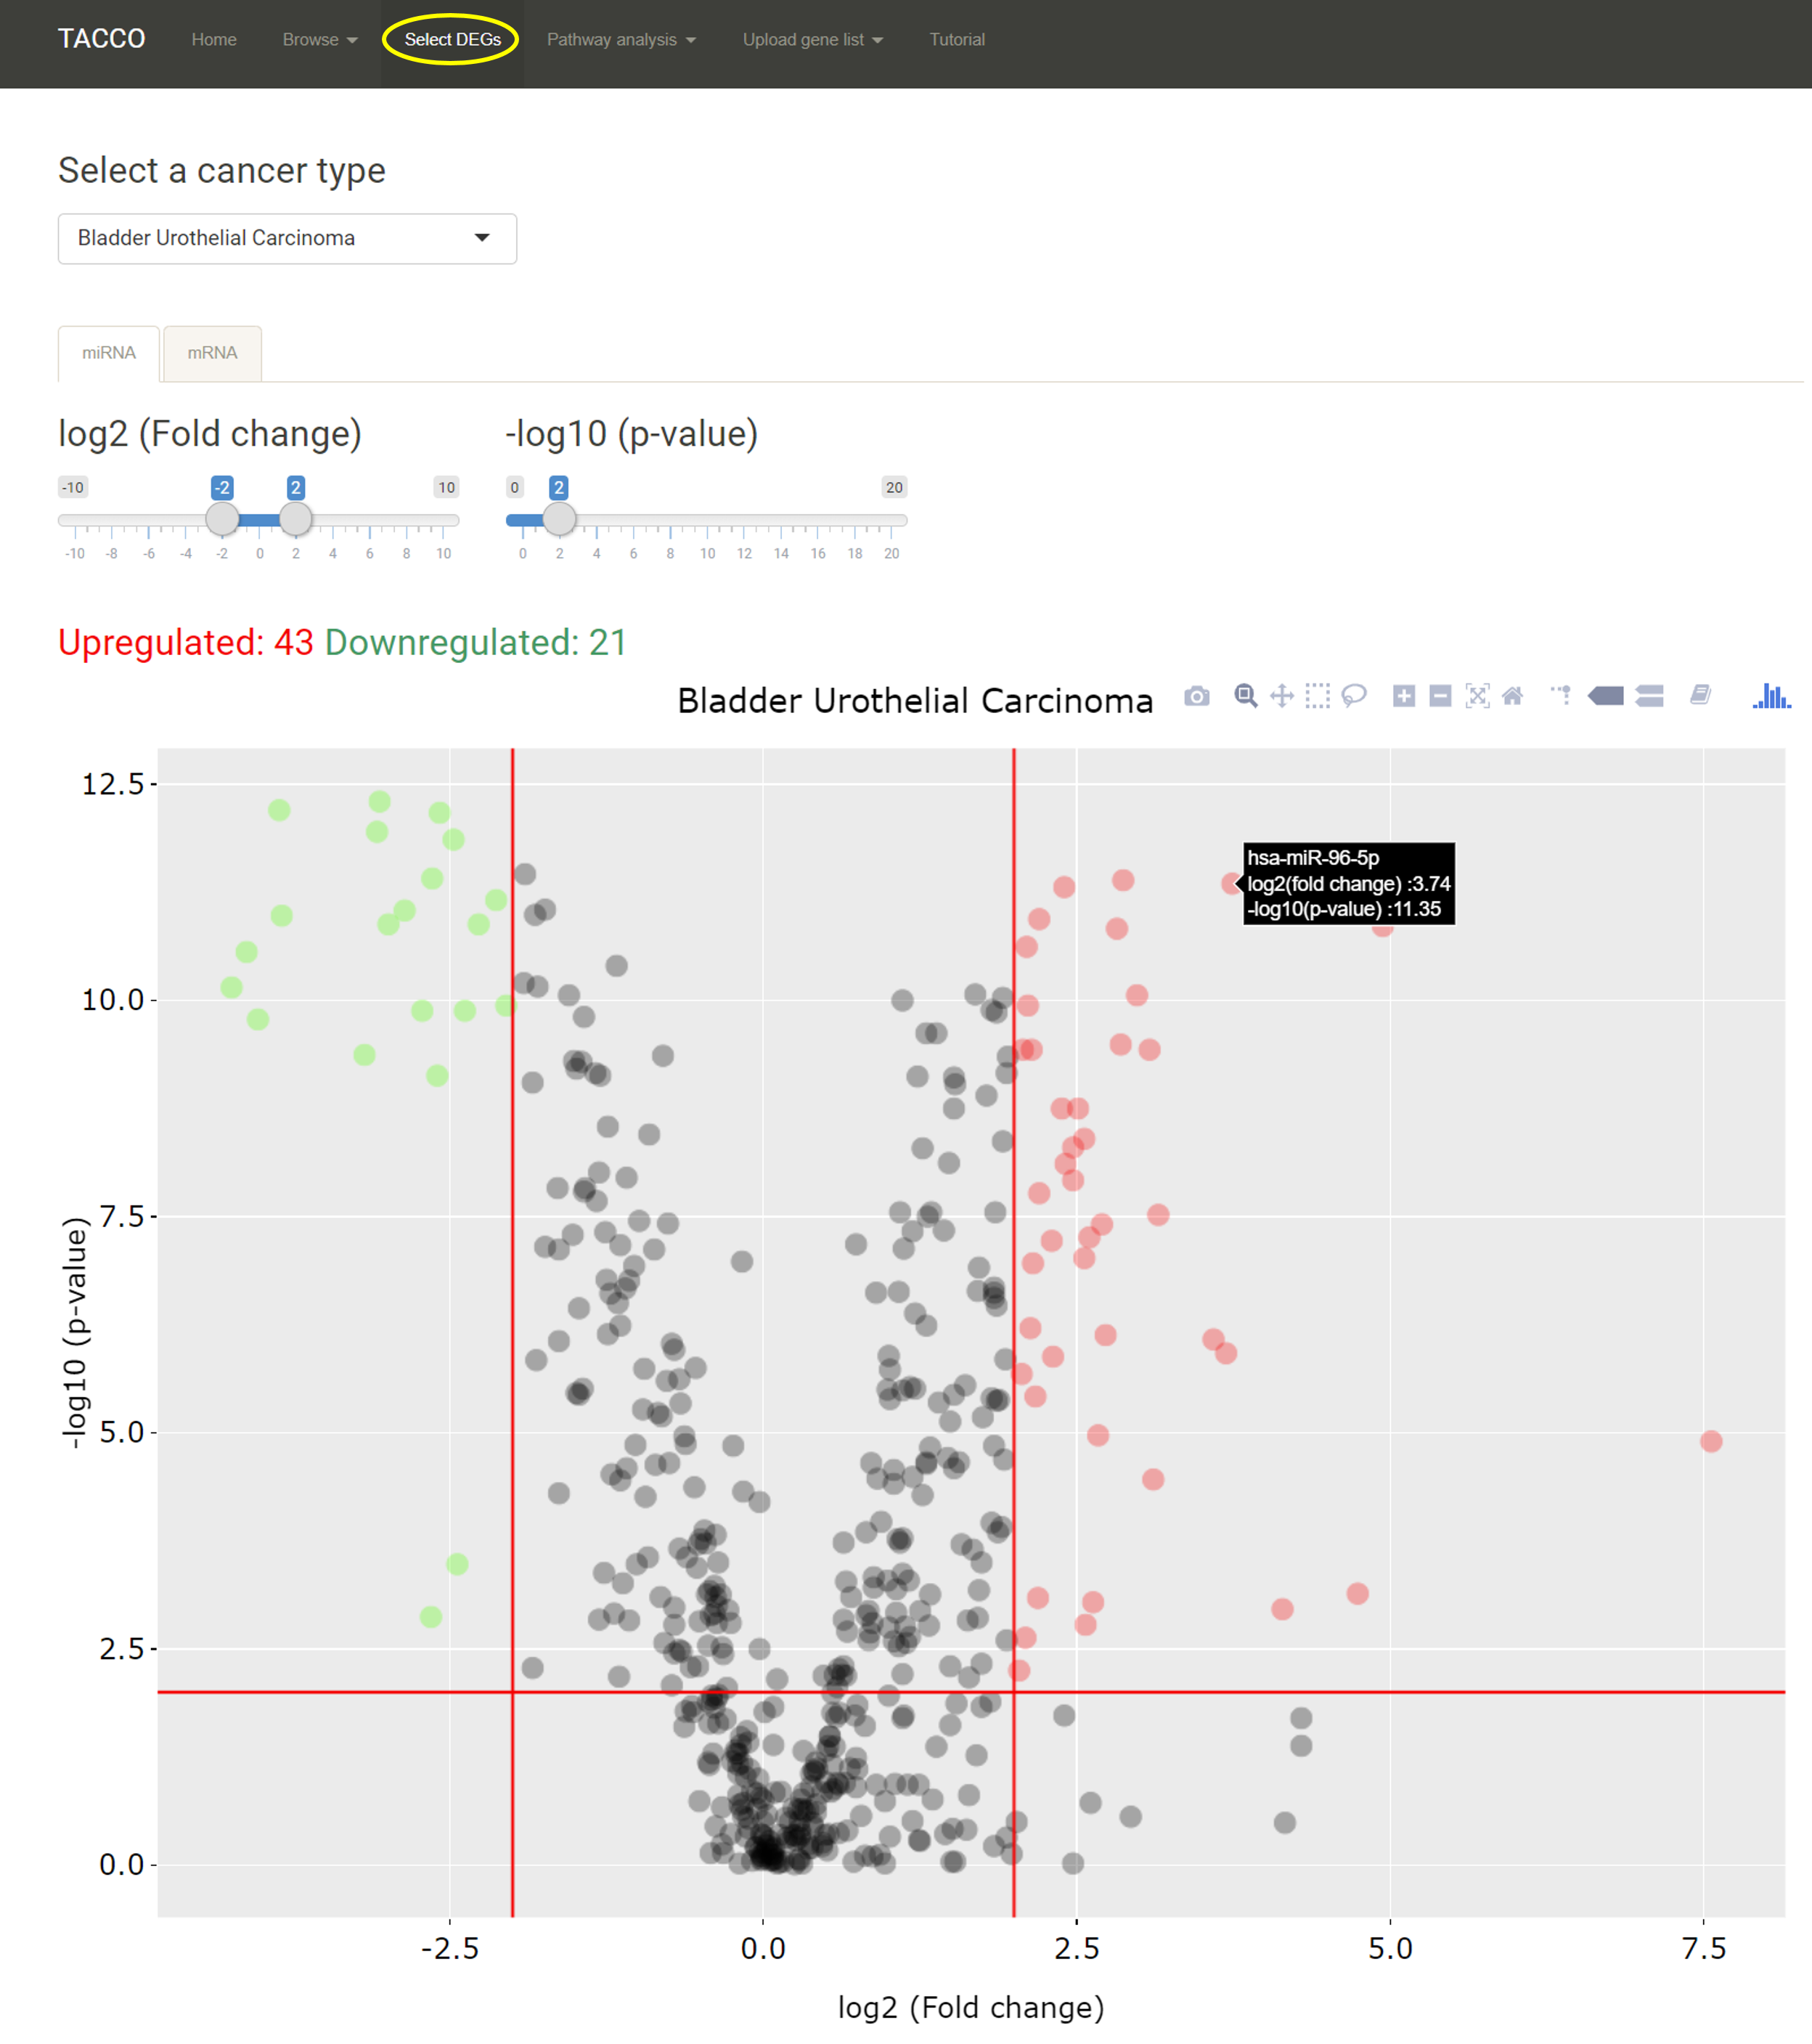
TACCO offers a volcano plot for users to select differentially expressed miRNAs (DEmiRNAss) with customized criteria.
Users can use the slider to select certain p-value and fold change to identify a list of DEmiRNAs.
The number of the significantly up/down regulated miRNAs will be listed on top of the volcano plot in red and green respectively. Users can select
different criteria and the number and the volcano plot will be updated on the fly.
*The details of the gene symbol, p-value and fold change will pop up if users mouse-over a specific data point on the volcano plot.
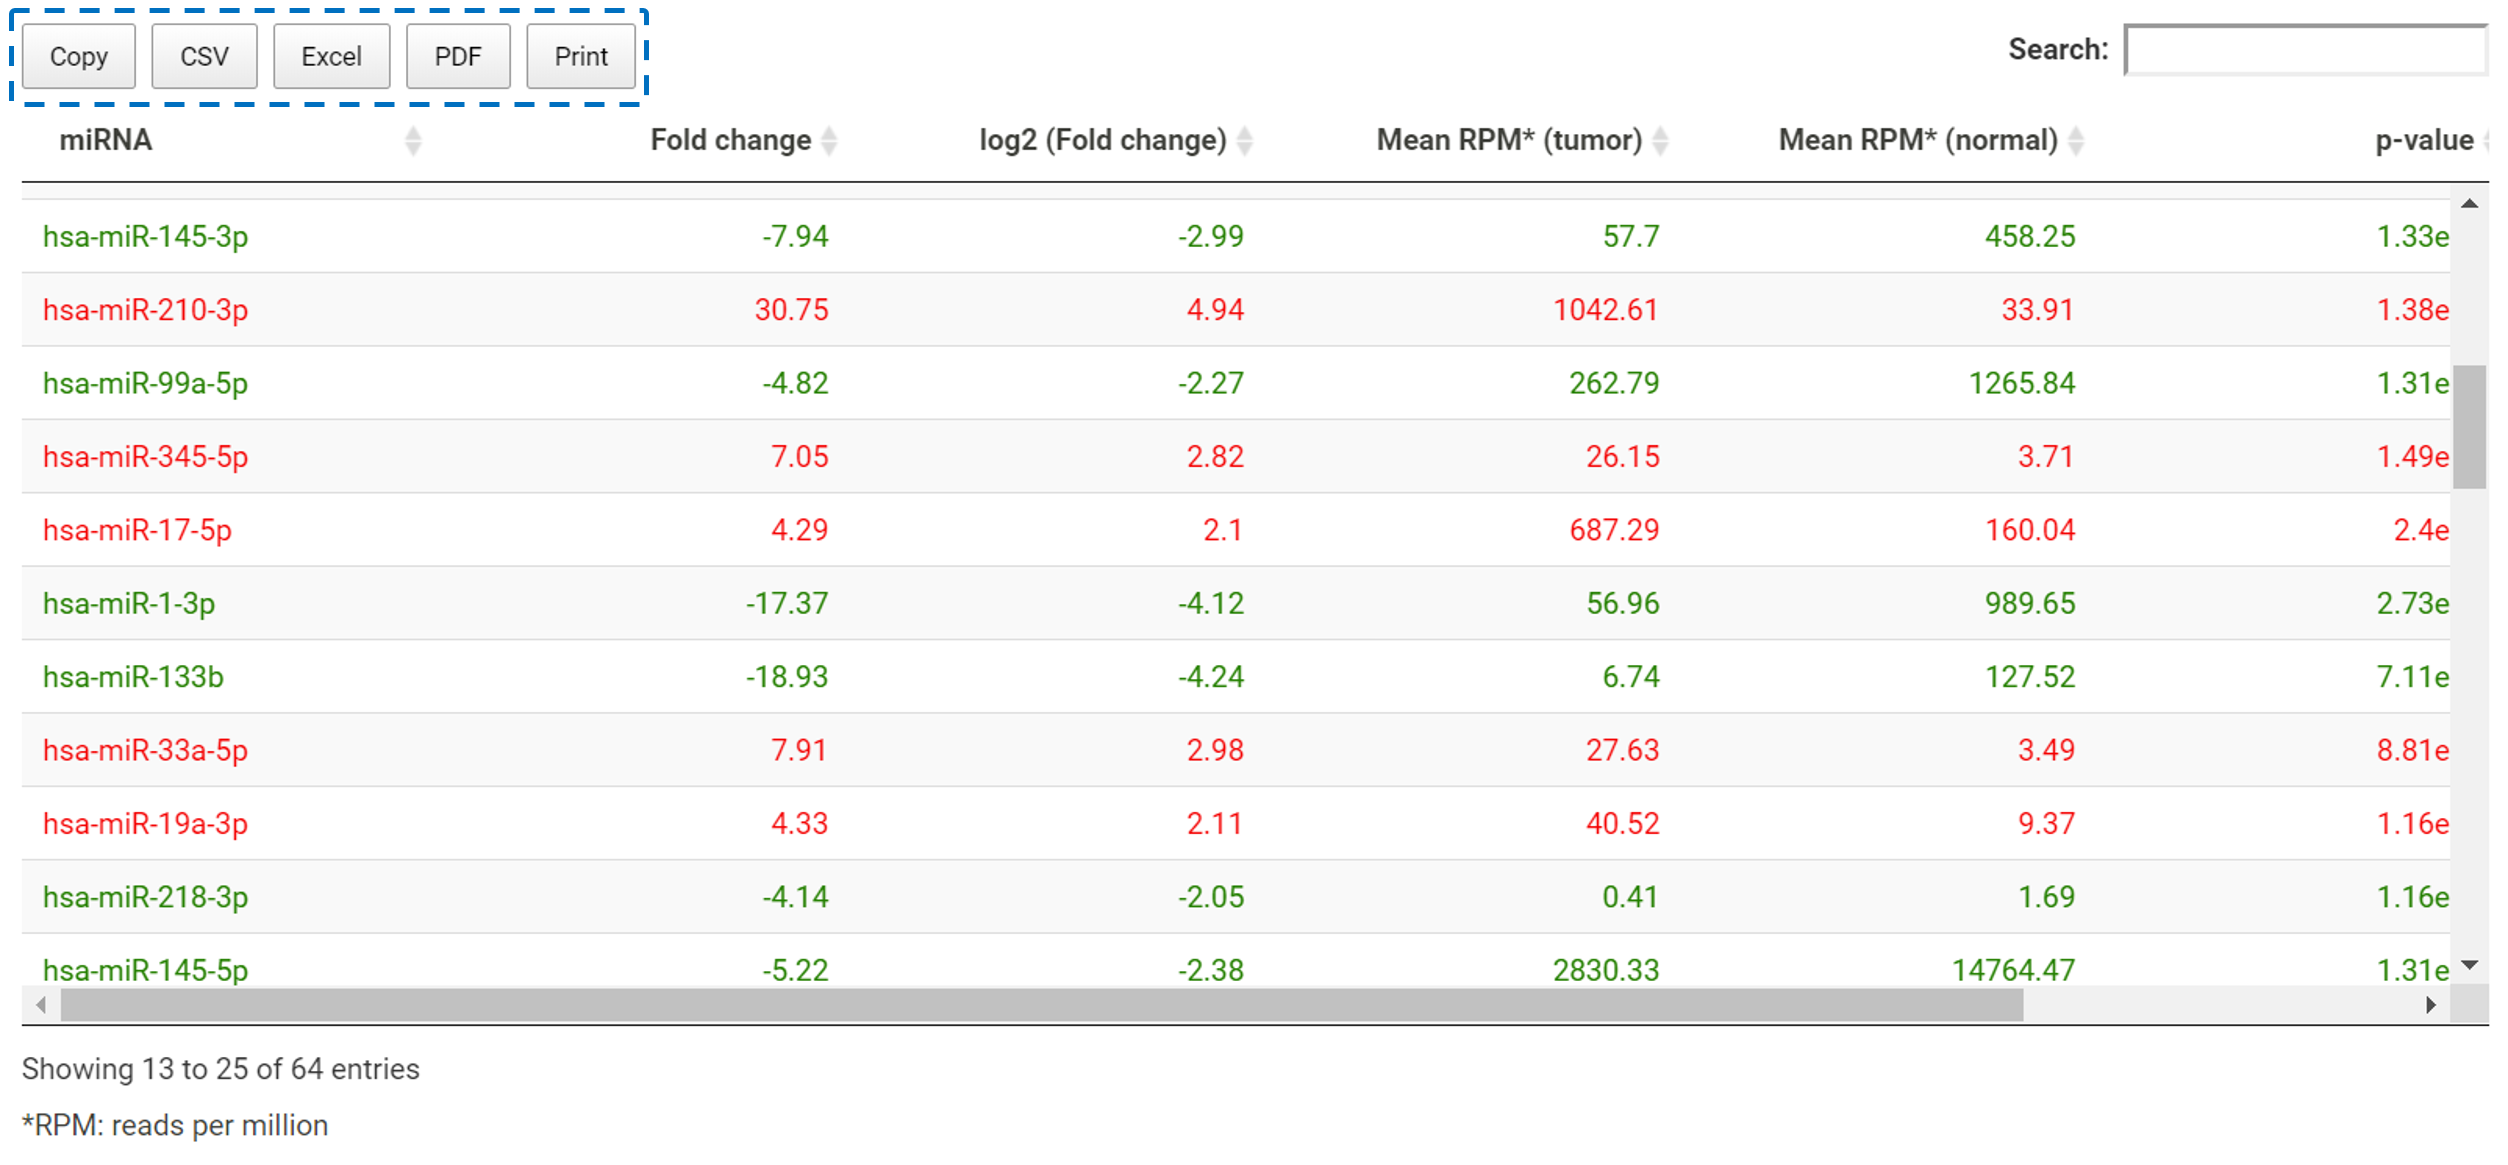
After the DEmiRNAs were identified, TACCO also provides a detailed table for the DEmiRNA list. Users can search in this table or download the whole table as a csv, excel or pdf file (the blue box). Each miRNA may be shown in red or green depends on whether they are defined as upregulated or downregulated.
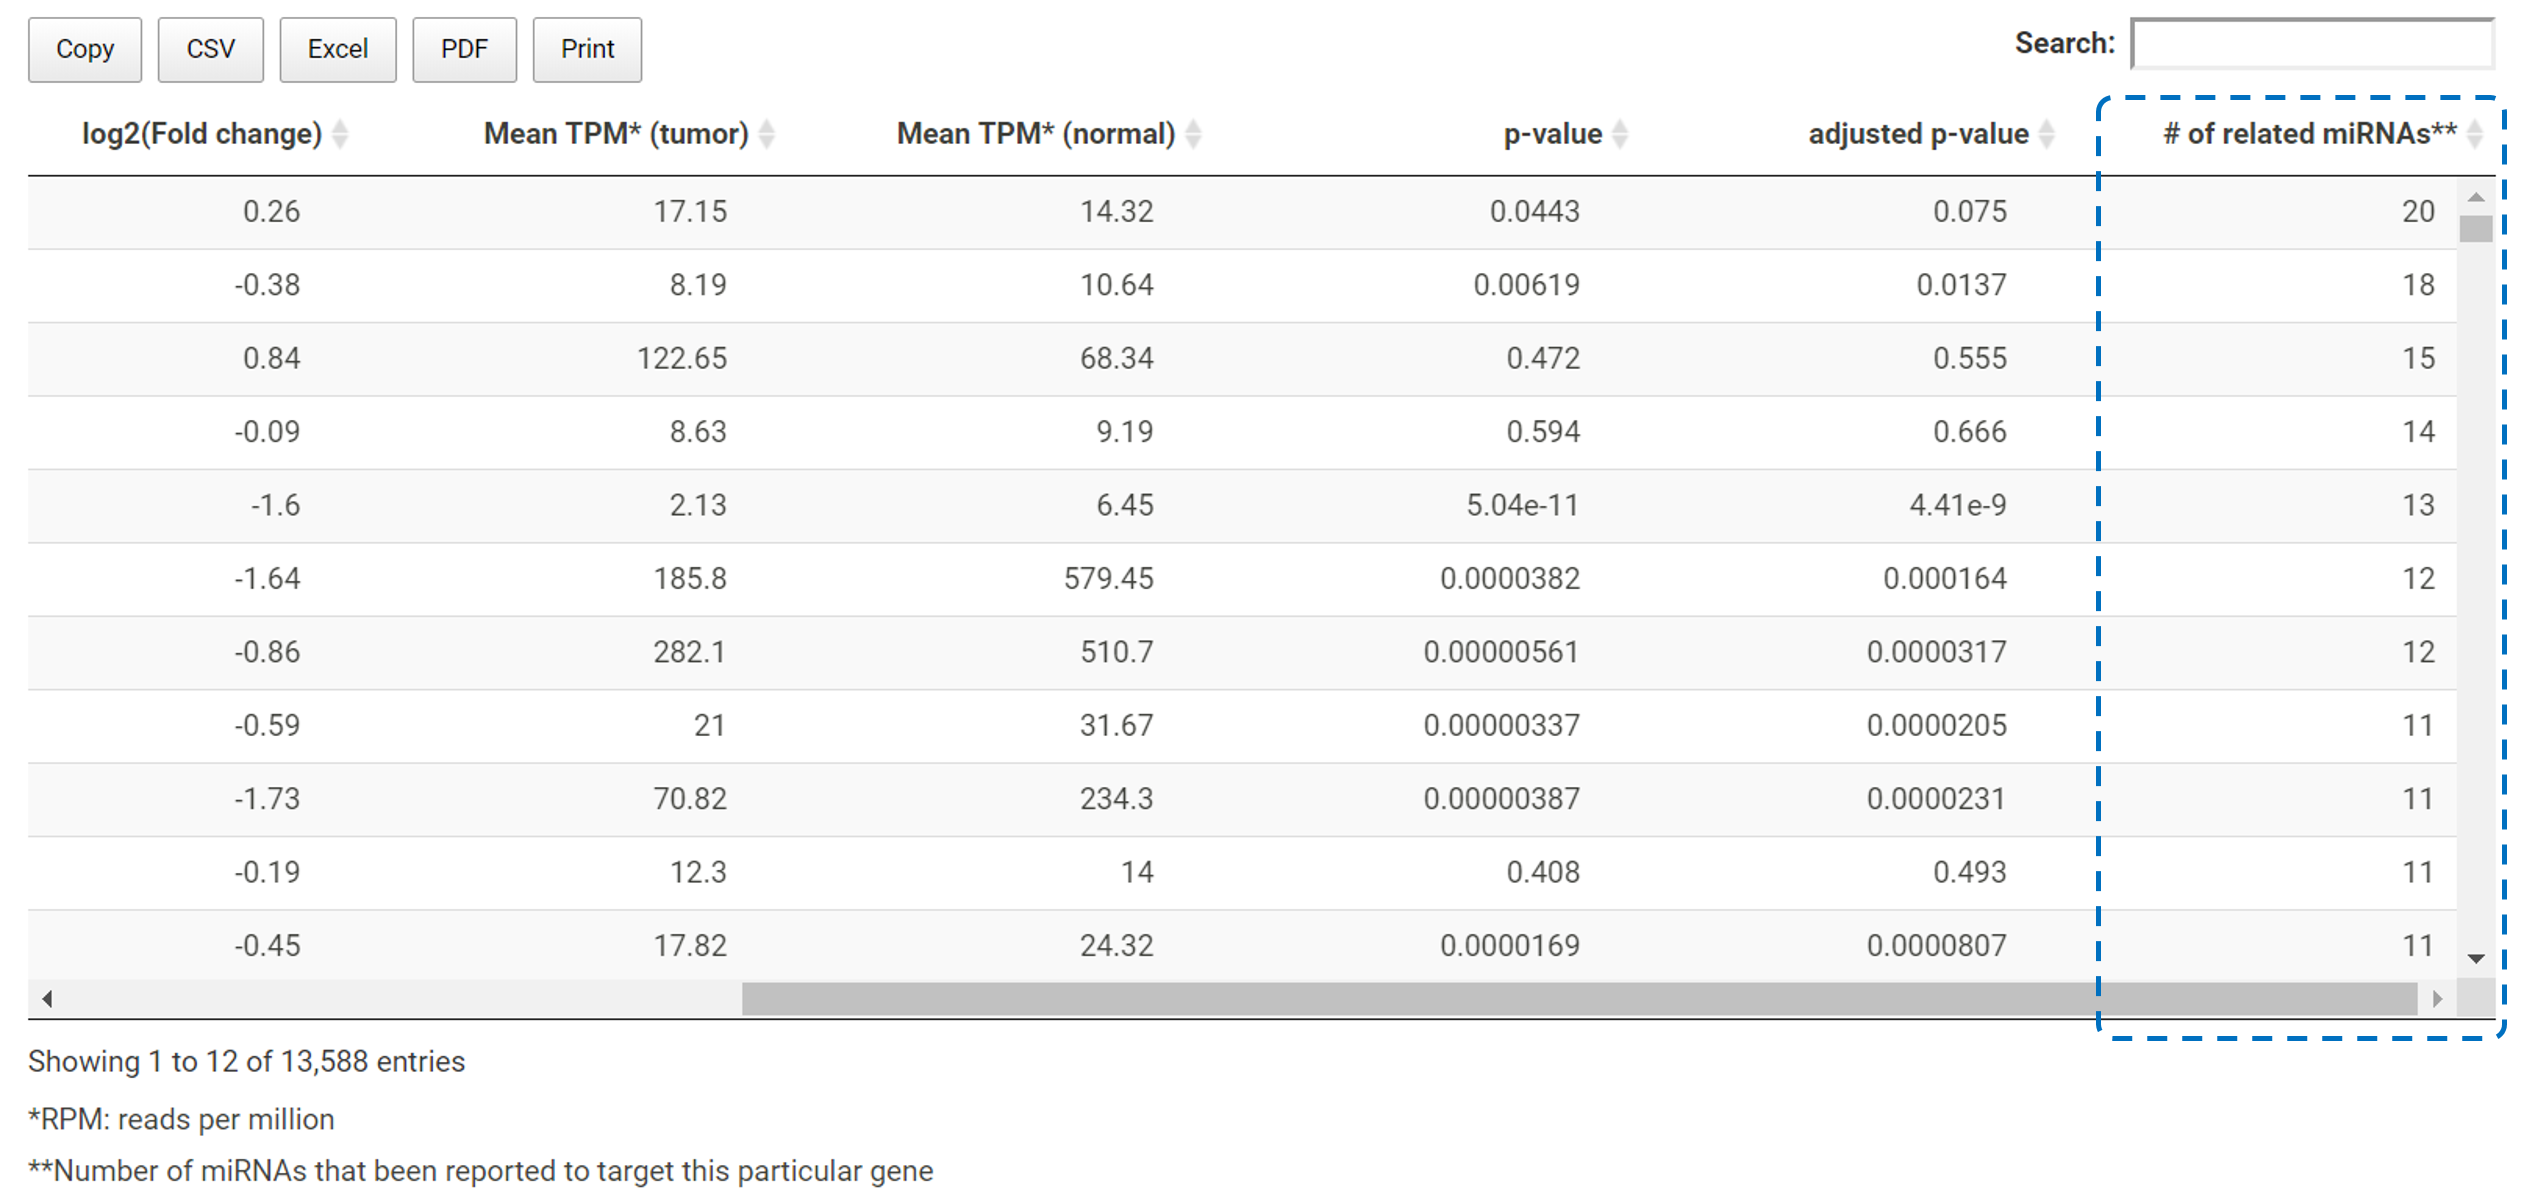
For DEmiRNAs, TACCO will further find the target genes for the DEmiRNAs and show the detail information in a table. In addition to all the fold change, p-value and expression levels in tumor and normal etc., in this table, TACCO further provides the number of DEmiRNAs targeted at that particular gene.