Identify DEGs
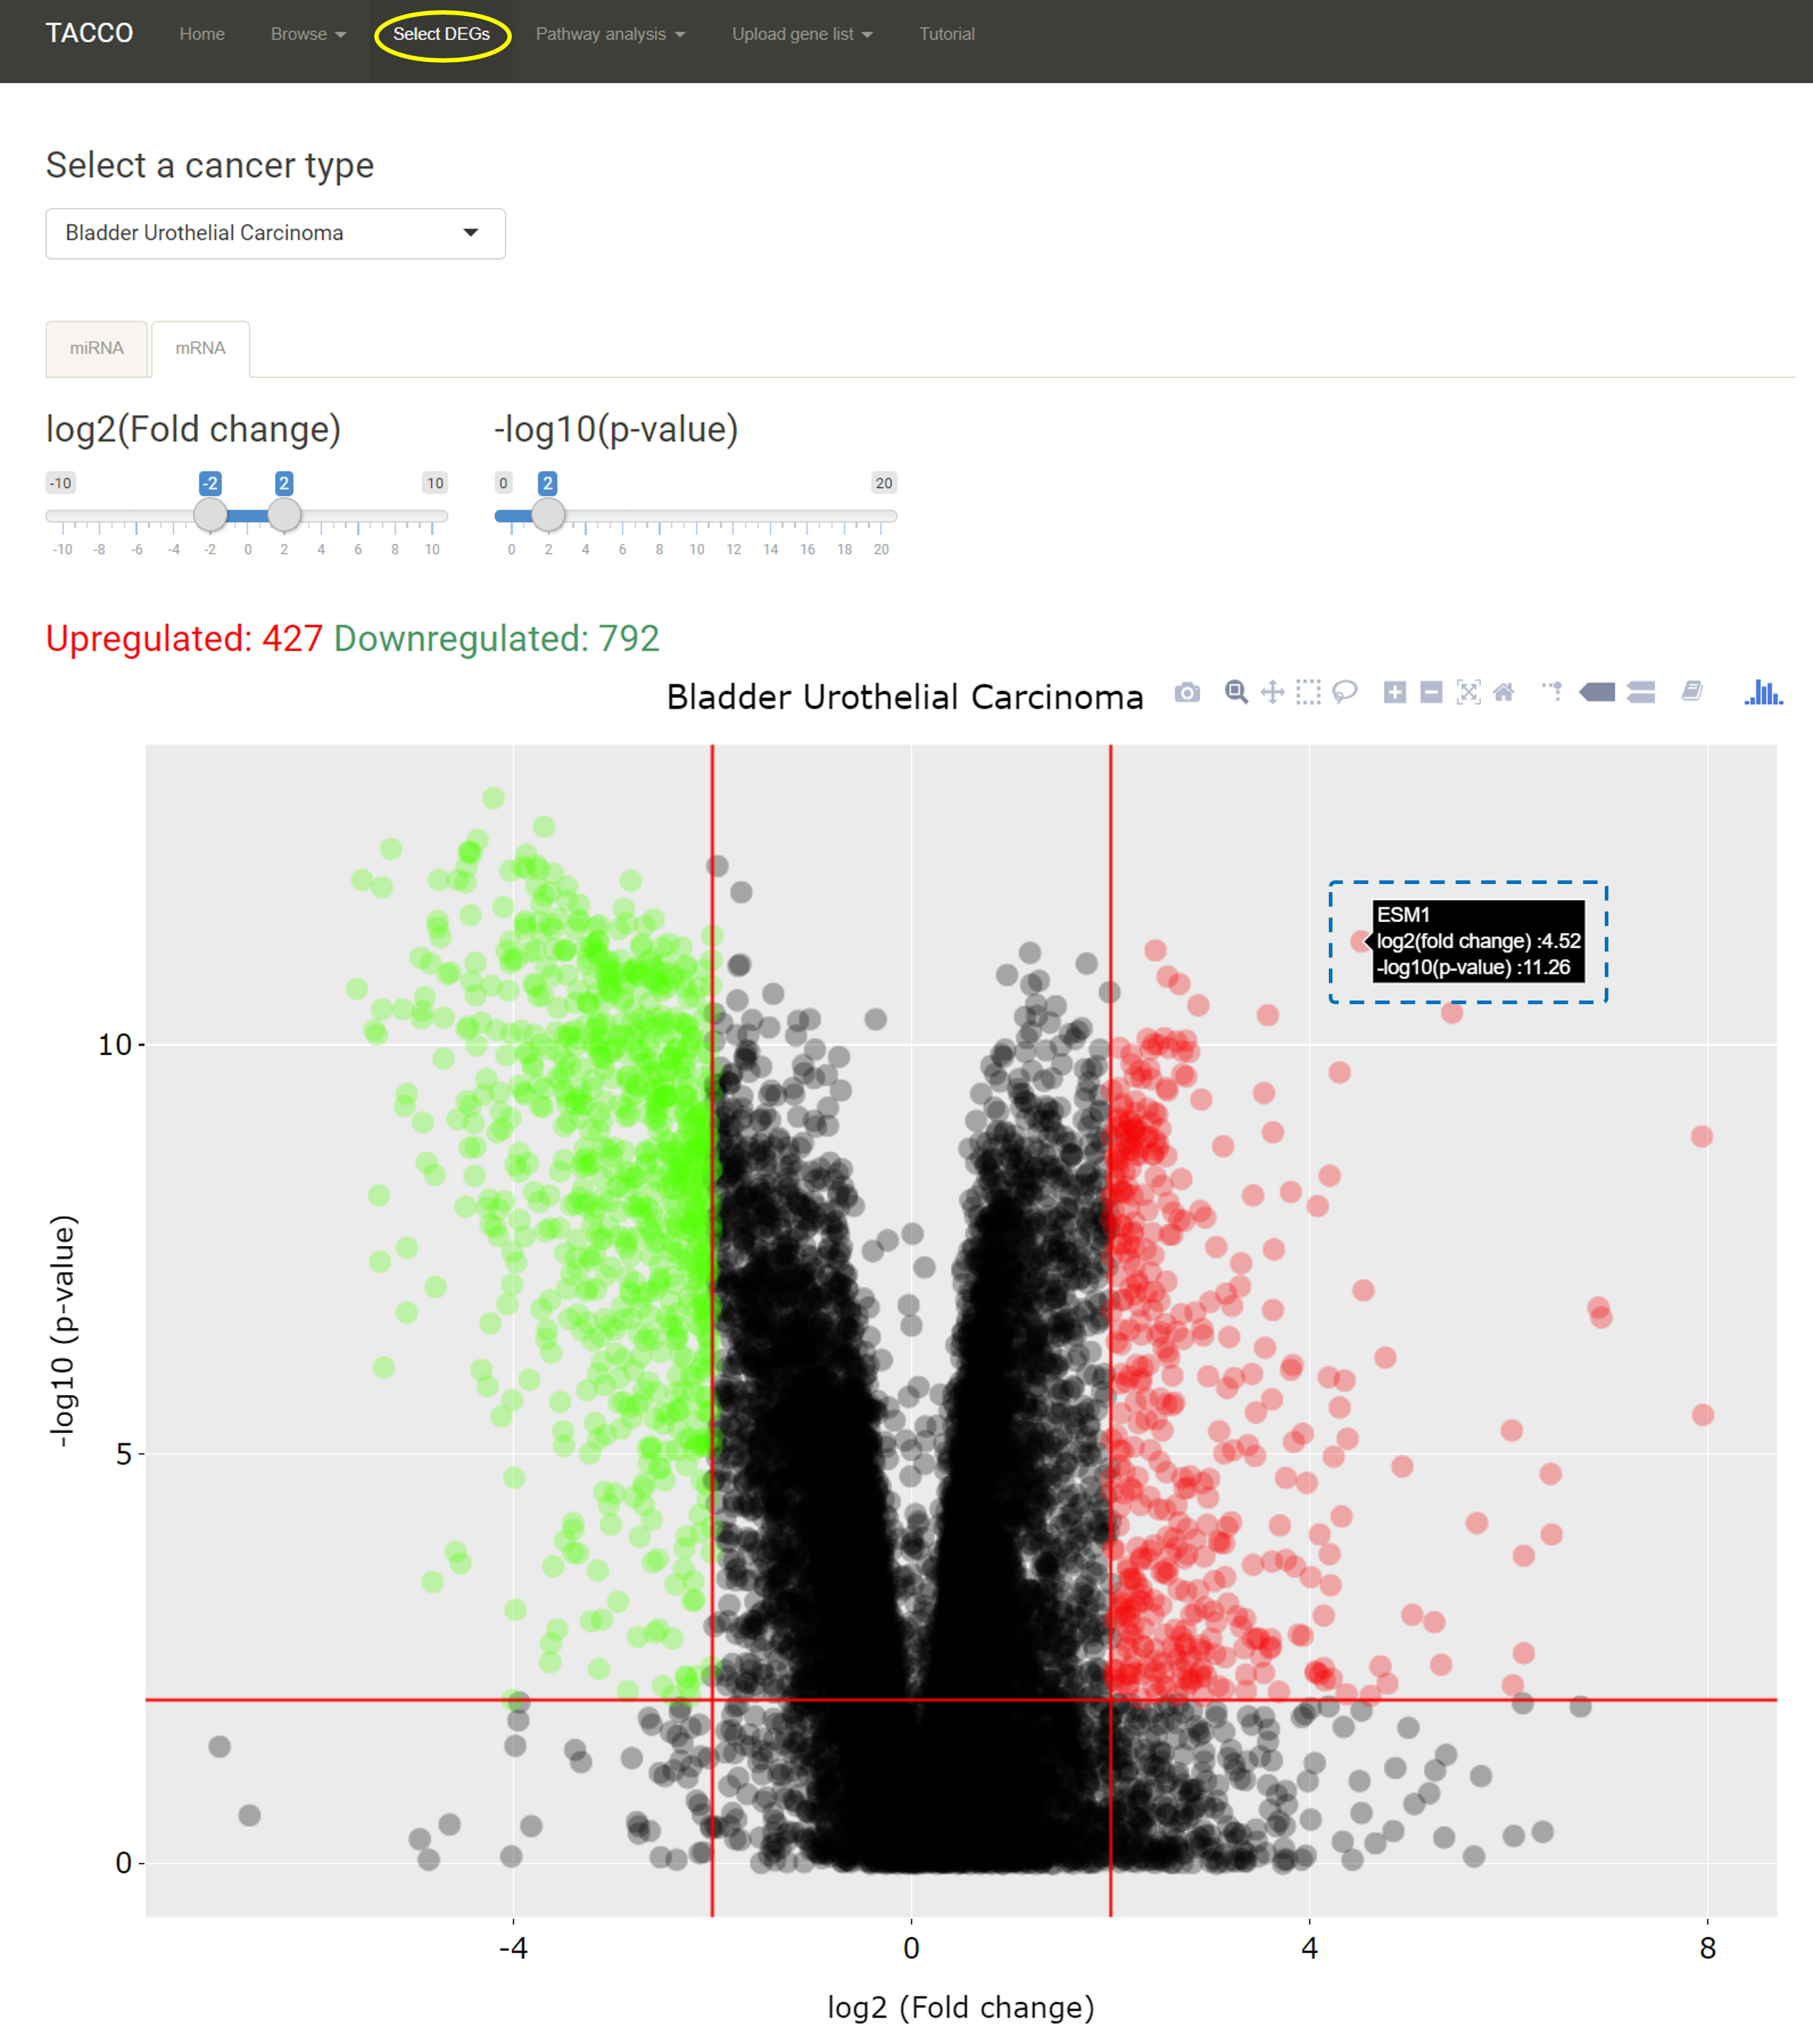
TACCO offers a volcano plot for users to select differentially expressed genes (DEGs) with customized criteria.
Users can use the slider to select certain p-value and fold change to identify a list of DEGs.
The number of the significantly up/down regulated gene will be listed on top of the volcano plot in red and green respectively.
Users can select different criteria and the number and the volcano plot will be updated on the fly.
*The details of the gene symbol, p-value and fold change will pop up if users mouse-over a specific data point on the volcano plot.
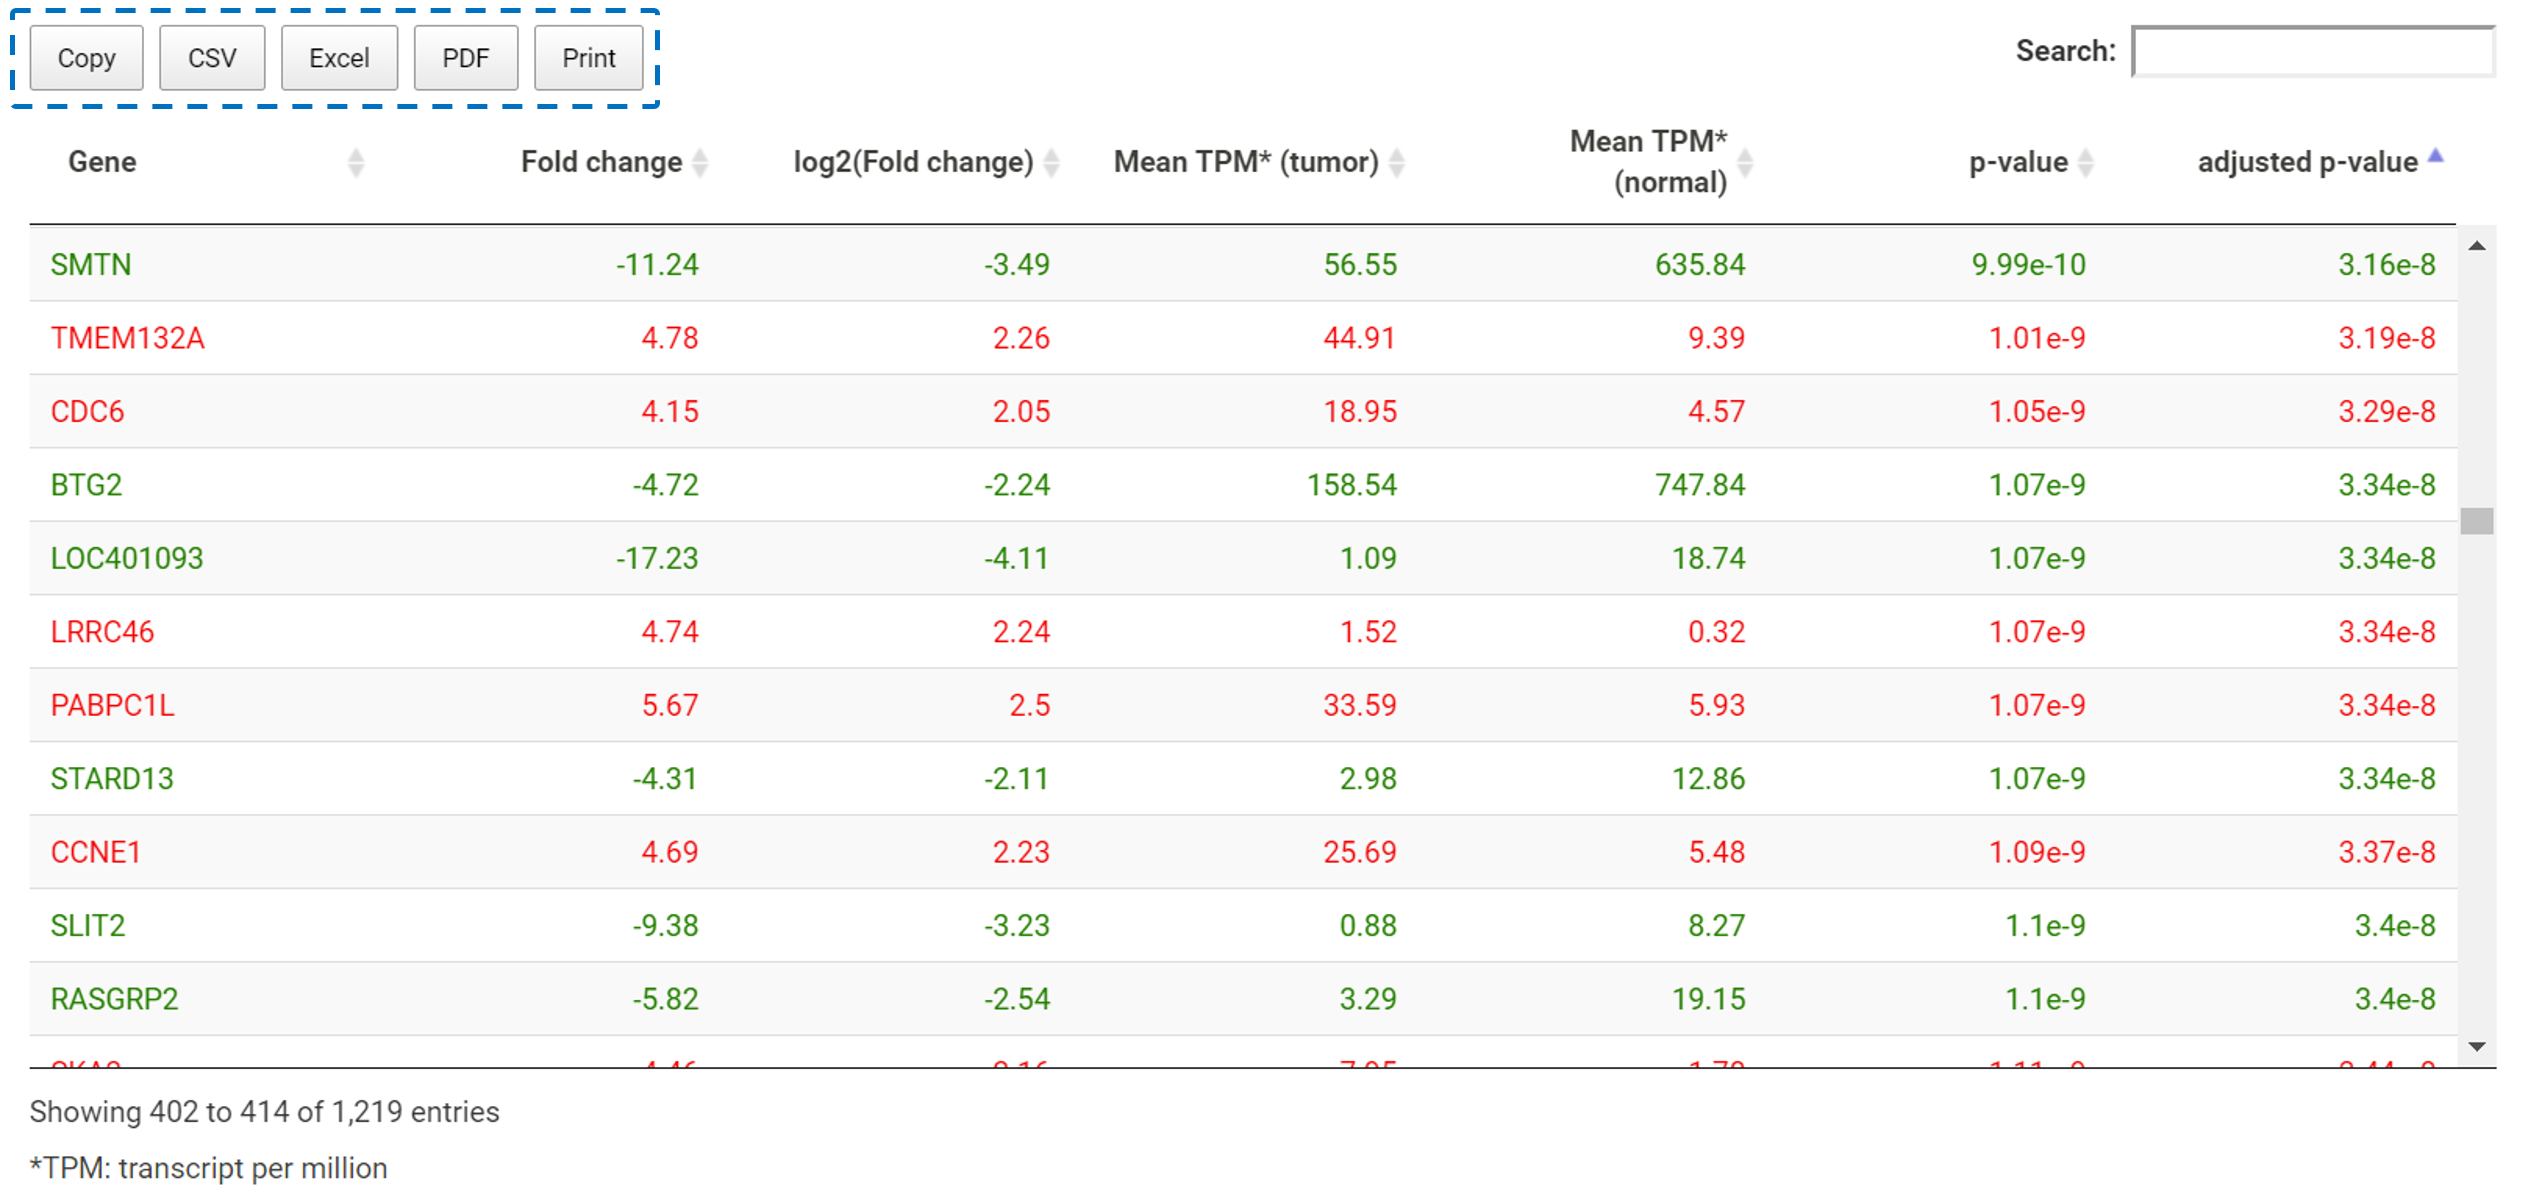
After the DEGs were identified, TACCO also provides a table for the DEGs. Users can search in this table or download the whole table as a csv, excel or pdf file (the blue box). Each gene may be shown in red or green depends on they are defined as upregulated or downregulated.